
The MACD trend following strategy at a glance
| Item | Setting |
|---|---|
| Instrument | Nifty futures, or options on the same signal |
| Candles | Daily for swing trades; 15-minute for intraday versions |
| Indicator | MACD (12, 26, 9) |
| Long entry | MACD line crosses above the signal line |
| Short entry | MACD line crosses below the signal line |
| Filter | Optional: trade longs only above zero, shorts only below |
| Exit | The opposite cross, or a trailing stop |
| Initial stop | 1.5% from the entry on daily candles |
| Best market | Long, steady trends |
| Worst market | Sideways ranges and sharp V-shaped turns |
Key takeaways
- MACD crosses come after turns. The strategy aims to catch the middle of long moves, not the tops and bottoms.
- The zero-line filter removes many false signals in ranges, and makes entries later at every turn.
- On the model series, the plain signal-line rule went short on day 37 and long on day 52; the filtered rule went short on day 41 and long on day 56.
- A 1.5% stop on one lot of Nifty futures risks about ₹24,000, more than 1% of a ₹10 lakh account. Spreads carry the same signal with a smaller, fixed risk.
- Costs are about ₹970 a round trip on one futures lot, roughly 15 Nifty points, so a strategy that trades often needs its average gain well above that.
How MACD works, in brief
The MACD line is the 12-period EMA of the closes minus the 26-period EMA. The signal line is a 9-period EMA of the MACD line, and the histogram is the gap between the two. A cross of the signal line shows the gap between the averages changing direction; a cross of zero shows the averages themselves crossing. The calculation, each part and the settings are worked through step by step in the guide to the MACD indicator.
With standard settings MACD needs 34 closes before the signal line exists, and many more before its values stop depending on where the calculation began. Load at least a year of daily data before the first signal you use.
Why trend following can work, and when it fails
Trend following rests on one observation: prices sometimes move a long way in one direction, and a rule that holds through those moves can make more on them than it loses on many small false starts. The rule does not need to predict the turn. It needs to stay in the trade while the trend lasts and get out without a large loss when it does not.
That shapes the results of every trend rule:
- Many small losses, a few large gains. Most signals in a range fail quickly. The few that catch a long move pay for them.
- A low win rate is normal. Trend rules often win fewer than half their trades. The ratio of the average gain to the average loss matters more.
- Long flat or losing stretches. In a sideways year the rule can lose for months. Testing has to include such years.
- V-shaped turns hurt. When the market reverses sharply, the rule exits late and enters the new direction late, and can lose on both.
The rules
The plain version: signal-line crosses
- Long: buy one lot when the daily MACD line closes above its signal line.
- Short: sell one lot when it closes below the signal line.
- Reverse: each opposite cross closes the trade and opens one the other way.
- Initial stop: 1.5% from the entry price.
- Size: set from the rupee loss at the stop, not from the margin.
The filtered version: signal line and zero line
- Long: buy when the MACD line is above both its signal line and zero.
- Short: sell when the MACD line is below both its signal line and zero.
- Exit: close the trade on the opposite signal-line cross. Do not reverse until both conditions hold the other way.
- Initial stop and size: as above.
Why the filter matters
The filter keeps the strategy on the side of the slower trend. A bullish signal-line cross below zero is a fall slowing down; a bullish cross above zero is a rise resuming. In a range, where MACD hovers near zero and crosses its signal line often, the filter removes many of the false starts. The price is lateness: every entry has to wait for the averages themselves to cross.
The model Nifty series
The examples use a model series of 72 daily closes, a seeded random walk that is not market data. It rises to 25,500.00 on day 32, falls 5.26% to 24,158.55 on day 44 and recovers to 25,867.60 by day 72. The same series is used in the guides to MACD, RSI, moving averages and Bollinger Bands.
| Day | Close | MACD line | Signal line | Event |
|---|---|---|---|---|
| 32 | 25,500.00 | 203.05 | Not yet available | Price high |
| 37 | 24,938.05 | 141.09 | 164.05 | MACD crosses below its signal line |
| 41 | 24,483.65 | −23.28 | 82.59 | MACD crosses below zero |
| 44 | 24,158.55 | −136.66 | −7.24 | Price low |
| 52 | 24,799.05 | −108.00 | −130.70 | MACD crosses above its signal line |
| 56 | 24,933.90 | 2.50 | −69.03 | MACD crosses above zero |
| 72 | 25,867.60 | 236.92 | 171.87 | Last session |
A worked trade on Nifty futures
The plain version, on one lot of Nifty futures of 65 units. The example treats the futures price as equal to the index and shows the mechanics, not a record of results.
- Day 37, closethe MACD line, 141.09, closes below its signal line, 164.05. Sell one lot at 24,938.05, five sessions and 561.95 points below the high. Stop 1.5% above, at 25,312.12, a risk of ₹24,315.
- Day 41, closeNifty at 24,483.65 and MACD below zero. The short is 454.40 points, or ₹29,536, in profit. The rule does nothing: there is no opposite cross.
- Day 44, closethe low, 24,158.55. The short is 779.50 points in profit, ₹50,668, but nothing in the rules marks this as the bottom.
- Day 52, closeMACD crosses back above its signal line. Buy two lots at 24,799.05: one to close the short for a gain of 139.00 points, ₹9,035, and one to open a long. New stop 1.5% below, at 24,427.06.
- Day 72, closeNifty at 25,867.60. The long is 1,068.55 points, or ₹69,456, in profit and still open, because MACD has not crossed down again.
- Costsabout ₹970 for the short's round trip and the same again when the long is closed.
Two things stand out. The short gave back most of its open profit: it was 779.50 points ahead at the low and closed 139.00 points ahead, because the exit waited for the cross. That is the cost of a rule that exits on confirmation rather than on a level. And the long caught most of the recovery because nothing in the rules ended it early. Trend following lives on trades like the long and has to survive trades like the short.
The same series with the zero-line filter
| Plain version | Filtered version | |
|---|---|---|
| Short entry | Day 37 at 24,938.05 | Day 41 at 24,483.65 |
| Short exit | Day 52 at 24,799.05 | Day 52 at 24,799.05 |
| Short result | +139.00 points | −315.40 points |
| Long entry | Day 52 at 24,799.05 | Day 56 at 24,933.90 |
| Long open at day 72 | +1,068.55 points | +933.70 points |
On this series the filter cost money at both turns: the short started after most of the fall and lost when the market rebounded, and the long started 134.85 points higher. The series has two sharp turns and no sideways stretch after day 25, which is the market where a filter helps least. In a long range, the same filter would have kept the strategy out of crosses that the plain version traded and lost on. One series cannot settle which version is better; a test over several years, including sideways ones, can.
Exits
The opposite cross is the simplest exit and the slowest. Three alternatives are common:
| Exit | How it works | On the model short from day 37 |
|---|---|---|
| Opposite signal-line cross | Close when MACD crosses back | Day 52 at 24,799.05, +139.00 points |
| Histogram turn | Close when the histogram moves against the trade for two bars in a row | Day 46 at 24,319.60, +618.45 points |
| Trailing stop on closes | Close when the price closes beyond the extreme close of the last 5 sessions | Day 49 at 24,332.45, +605.60 points |
The histogram exit on the short fires when the histogram rises for two sessions in a row: it bottomed at −129.41 on day 44 and rose on days 45 and 46. The trailing exit fires when the close rises above the highest close of the previous five sessions. Both kept far more of the move than the cross did, and both would also close many good trend trades early in a steadier trend. Exits are where most of the testing effort belongs.
Giving back open profit
The worked short shows the hardest part of trend following to live with. At the low on day 44 the trade was 779.50 points ahead, ₹50,668 on one lot. It closed on day 52 at 139.00 points ahead, ₹9,035. It gave back 640.50 points, ₹41,633, while the rule waited for MACD to cross back. Nothing went wrong: the rule did exactly what it was built to do.
Traders who cannot accept that usually override the rule after a few such trades, and the overrides tend to come at the worst moments. Two honest alternatives exist. One is a faster exit, chosen in advance and tested, such as the histogram or trailing exits above. The other is to scale out of part of the position, which locks in some gain without giving up the trend.
Scaling out of a trend trade
A common plan closes half the position when the open gain equals the initial risk and lets the other half run on the original exit. On the model long from day 52, the initial risk was 371.99 points, so the first half would close on the first close at or above 25,171.04. That came on day 62, at 25,191.55, for a gain of 392.50 points on the half. The second half was still open on day 72, 1,068.55 points ahead.
Scaling out lowers the swing in the account and the gain on the best trades. Whether it improves a strategy depends on how often trades reach the first target and then reverse, which only a test on many trades shows. It also needs at least two lots, or two option spreads, to split.
Long-only and long-short versions
The rules above trade both sides. A long-only version buys on the bullish cross and goes flat on the bearish one. It avoids holding a short through a sharp rally and suits traders who prefer bought calls or call spreads to shorts. On the model series it would have been flat from day 37 to day 52 and long from day 52, missing the short's 139.00 points and taking the same long.
Index markets have tended to rise over long periods, so long-only trend rules on Nifty give up fewer good trades than long-only rules in a market with no long-term drift. Shorts still matter for hedging a portfolio and for options strategies built on bearish signals.
Filters that reduce false signals
- The zero line. Longs above zero, shorts below.
- A long moving average. Longs only above a rising 200-day average, shorts only below a falling one.
- ADX. Trade crosses only when ADX is above 20 to 25, which marks a trending market.
- The higher timeframe. Take 15-minute crosses only in the direction of the daily MACD.
- Event days. Skip entries the day before the RBI policy, the Union Budget and similar events, when a gap can jump past the stop.
Each filter removes trades. Add one at a time and keep it only if it improves results across many years, not just the last one.
MACD settings compared
| Setting | Signal line from | Crosses on the model series |
|---|---|---|
| (12, 26, 9) | Day 34 | Short day 37, long day 52 |
| (8, 17, 9) | Day 25 | Long day 26, short day 36, long day 50 |
| (5, 35, 5) | Day 39 | Long day 49 |
| (19, 39, 9) | Day 47 | Long day 54 |
Faster settings trade more and turn sooner; slower ones trade less and need more history. The standard (12, 26, 9) is a reasonable default. Changing it until past crosses line up with past turns is the most common way to overfit a MACD rule.
MACD on Bank Nifty and stocks
The rules carry over unchanged, but the numbers do not. MACD is measured in points, so its values on Bank Nifty, near 56,000, run about 2.2 times larger than on Nifty for the same percentage move; compare signals, not values. A 1.5% stop on Bank Nifty is about 840 points, ₹25,200 on one lot of 30, close to the rupee risk of a Nifty lot at the same percentage. Stocks gap on results and news, which can jump through a stop, and stock futures held to expiry settle by delivery of shares, so close or roll them before the expiry week. To compare momentum across stocks, use the percentage price oscillator rather than MACD itself.
Where MACD trend rules come from
Gerald Appel built MACD in the late 1970s as a trend and momentum tool, and Thomas Aspray added the histogram in 1986 to give earlier warning of crosses. Trend-following rules on moving averages are older still: they were in wide use by the middle of the twentieth century. What has changed since is testing. A rule that once had to be checked by hand on charts can now be run over years of data with costs in minutes, which makes it easy to test, and just as easy to overfit.
Intraday MACD
On 15-minute candles the rules are the same, with three changes. The trade closes by 3:15 pm whatever the signal. Entries in the first 15 minutes after 9:15 am are skipped, because the opening gap moves both EMAs at once. And the daily MACD sets the direction: only buy 15-minute bullish crosses while the daily MACD is above its signal line. Intraday trades are smaller in points, so costs take a much larger share of each gain.
Trading the signal with options
A trend trade on Nifty futures makes or loses ₹65 a point on one lot. Options can carry the same signal with a known loss. Trend trades last weeks, so monthly expiries suit them better than weekly ones. Model values with Nifty at 25,000, 30 days to expiry and IV of 14%, per lot of 65:
- Long call: buy the 25,000 call at ₹469.35, or ₹30,508. The most it can lose is the premium.
- Bull call spread: buy the 25,000 call and sell the 25,500 call for a debit of ₹222.33, or ₹14,451. The maximum profit is ₹18,049 at or above 25,500.
| Nifty after the signal | Futures | Long call | Bull call spread |
|---|---|---|---|
| Up 400 points after 10 sessions | +₹26,000 | +₹10,410 | +₹5,179 |
| Flat after 10 sessions | ₹0 | −₹6,287 | −₹923 |
| Down 300 points after 10 sessions | −₹19,500 | −₹15,583 | −₹5,249 |
| Up 800 points after 20 sessions | +₹52,000 | +₹25,677 | +₹12,576 |
The long call pays for time while the trend develops; the spread loses far less when it does not, and gives up the upside beyond 25,500. For a strategy whose signals fail more often than they succeed, the smaller loss on failed signals often matters more than the capped gain on the good ones.
Position sizing
Size from the loss at the stop. A 1.5% stop on Nifty near 25,000 is about 373 points, ₹24,250 on one lot. With 1% of capital at risk per trade:
| Account | Risk budget at 1% | Futures lots at a 1.5% stop |
|---|---|---|
| ₹10,00,000 | ₹10,000 | 0 |
| ₹25,00,000 | ₹25,000 | 1 |
| ₹50,00,000 | ₹50,000 | 2 |
A smaller account cannot hold one futures lot at this stop within 1%. The choices are a spread, whose maximum loss is known, a tighter stop, which will be hit more often, or a larger share of the account at risk. The bull call spread above risks ₹14,451 at most.
Costs, slippage and tax
- Futures charges come to about ₹970 for a round trip in one Nifty lot, most of it the 0.05% STT on the sale. That is about 15 points a trade. Compare brokers in the brokerage calculator.
- Option charges are far lower, about ₹200 for a two-leg spread's round trip, because STT is charged on the premium, not the contract value.
- Slippage is worst on stops in fast markets. Allow a point or two per order on index futures.
- Rollover. A trend trade held through the monthly expiry has to be rolled to the next contract, which costs a second round trip and the spread between the two contracts.
Brokerage, STT, exchange charges, SEBI fee, stamp duty and GST for one round trip, by broker.
Profits from futures and options are generally taxed as non-speculative business income.
How to backtest a MACD strategy
- Use enough data. Several years of daily candles, including trending and sideways years.
- Act on closed candles. A cross that appears mid-session can vanish by the close.
- Include costs and slippage. Every trade, including rollovers.
- Test the exits separately. Keep the entry fixed and compare exits, then the other way round.
- Change one setting at a time. If results swing a lot between neighbouring settings, the rule is fragile.
- Keep data back. Design on one part of the history and judge on another.
- Read the trade list. Count the longest losing streak and the deepest drawdown; they decide whether the rule can be followed in practice.
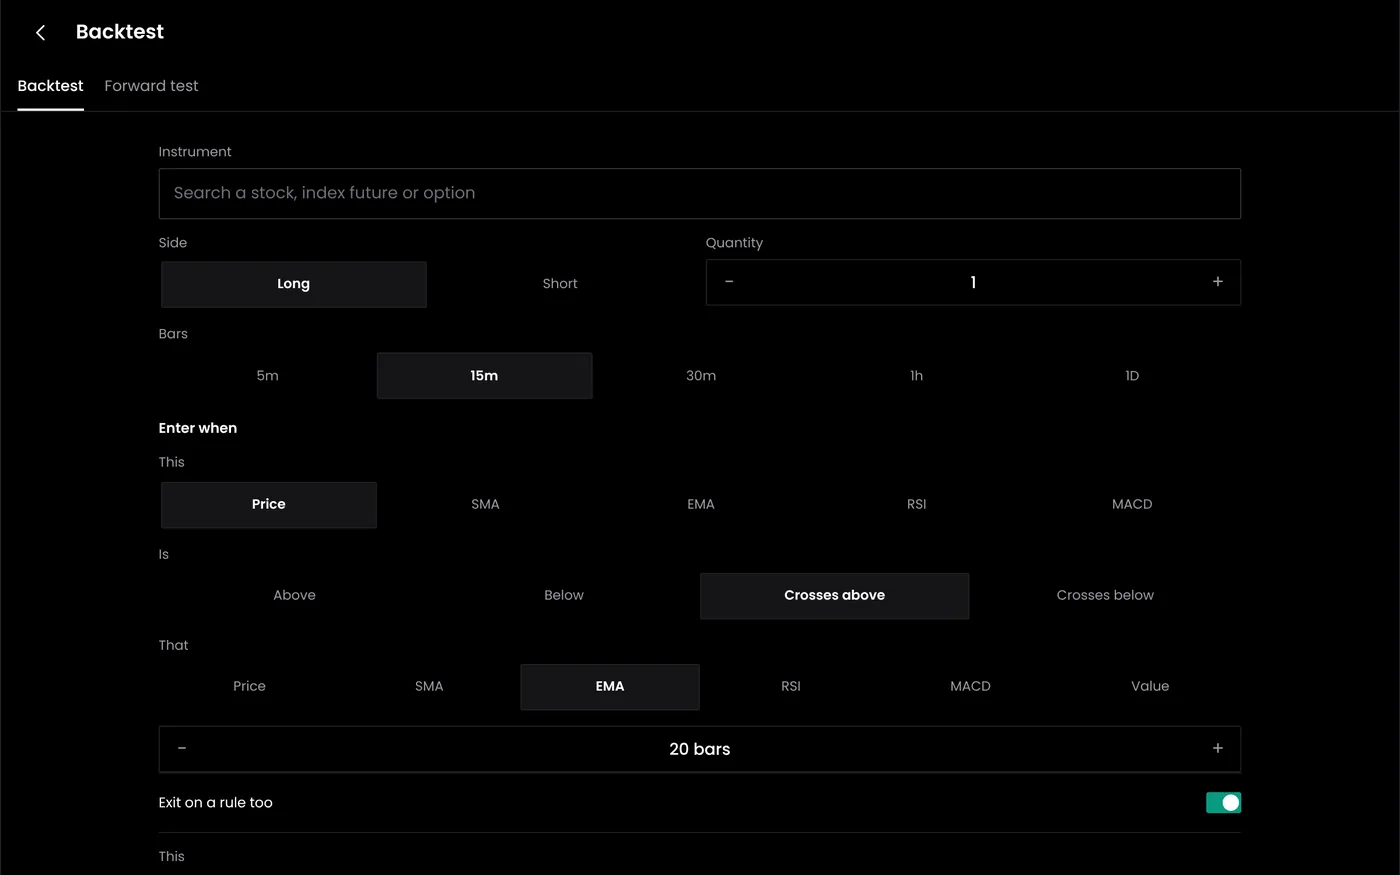
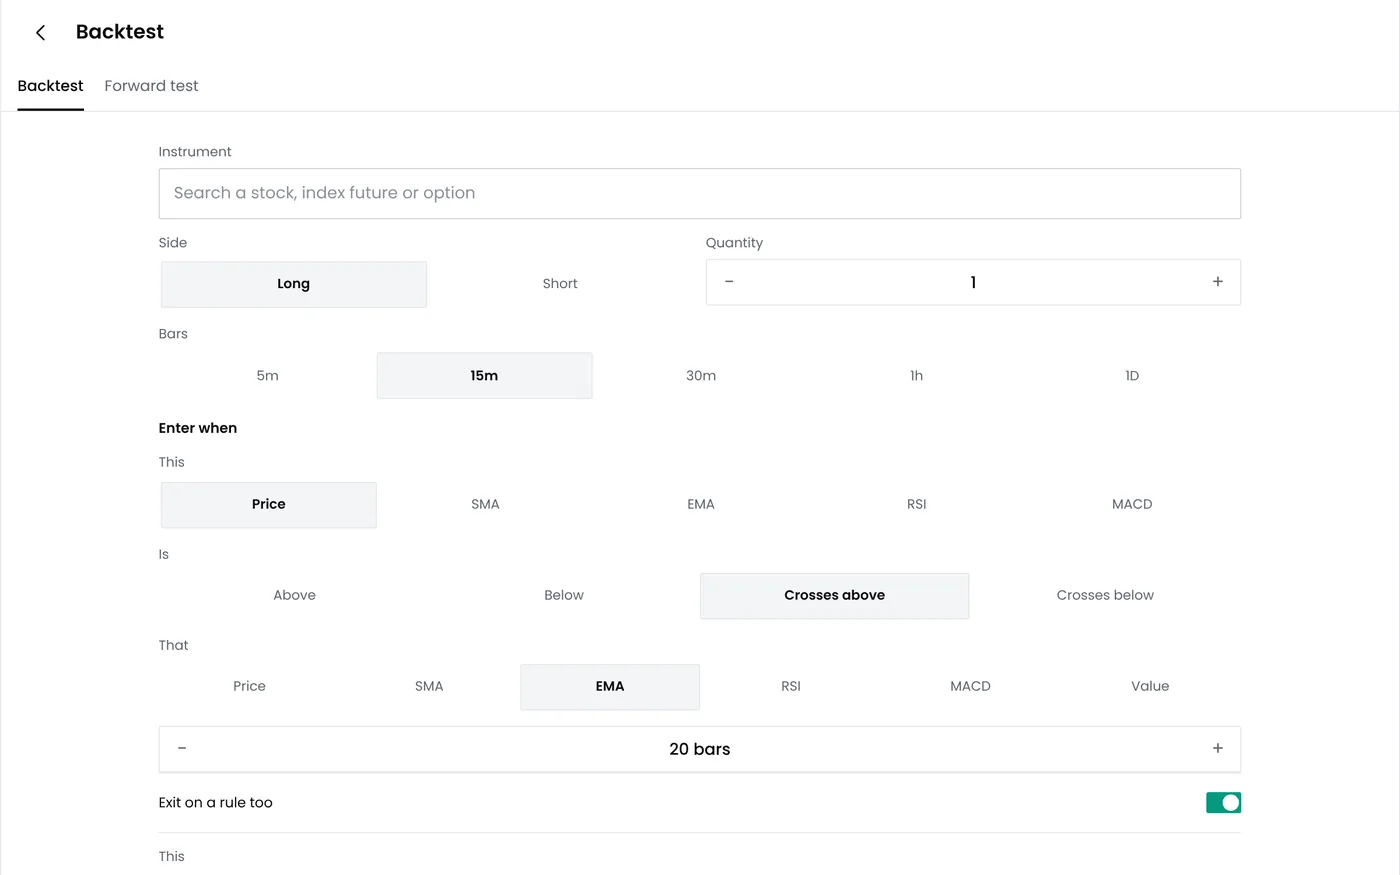
Setting up the MACD strategy in QuantPower
| Rule | Example setting |
|---|---|
| Instrument | Nifty futures, current month, rolled before expiry |
| Candles | Daily |
| Entry | MACD (12, 26, 9) line above its signal line; optionally also above zero |
| Exit | The opposite cross, or a histogram or trailing exit |
| Stop | 1.5% from the entry |
| Size | 1% of capital at risk between entry and stop |
| Skip days | RBI policy, Union Budget and other event days |
| Daily limit | Your MTM loss limit for the account |
Step 1. Build the rules
In the option strategy builder, choose Nifty futures and daily candles, add the MACD entry condition and the exit, and set the instrument to roll before expiry.
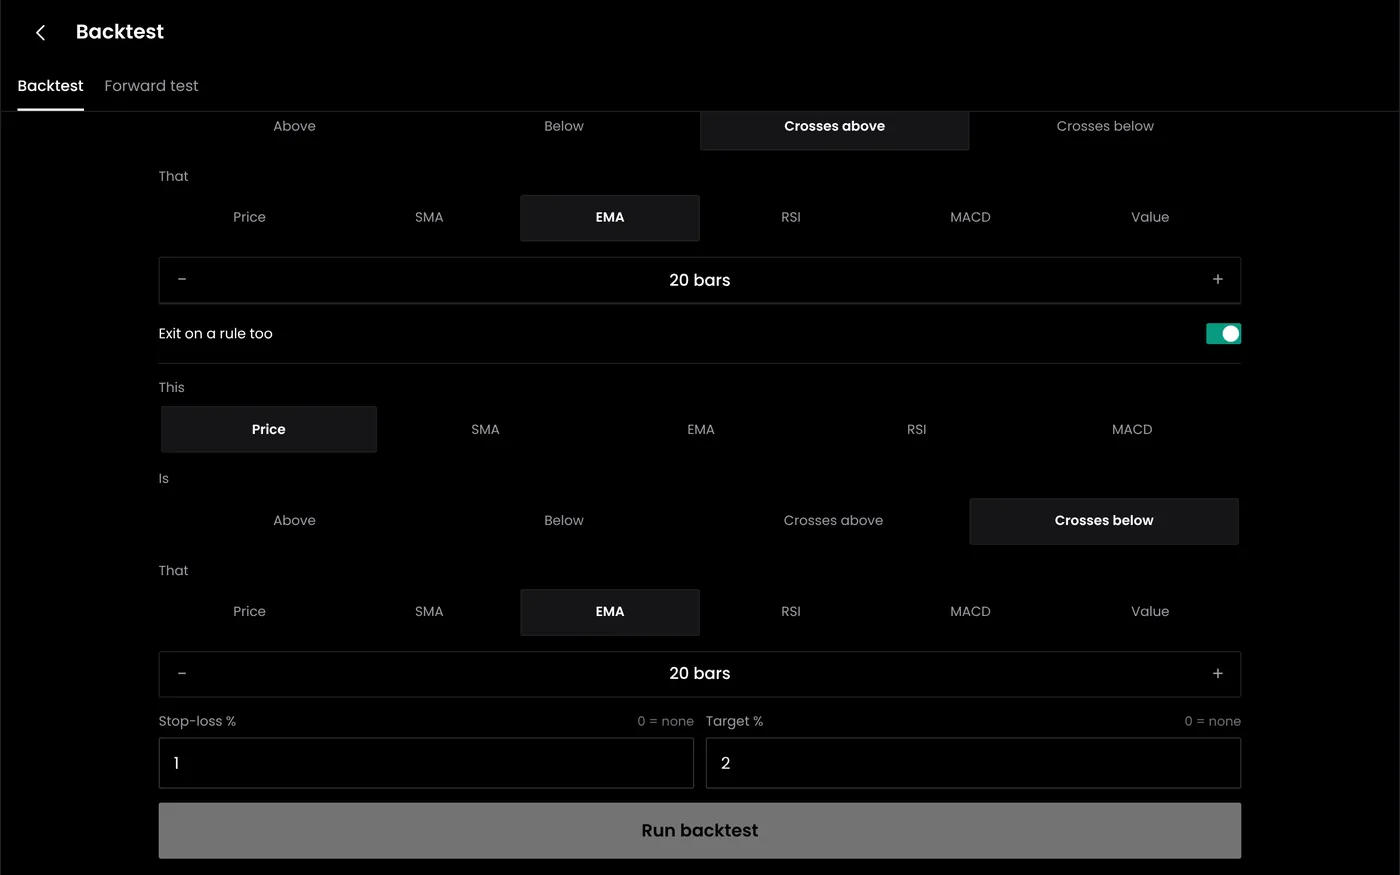
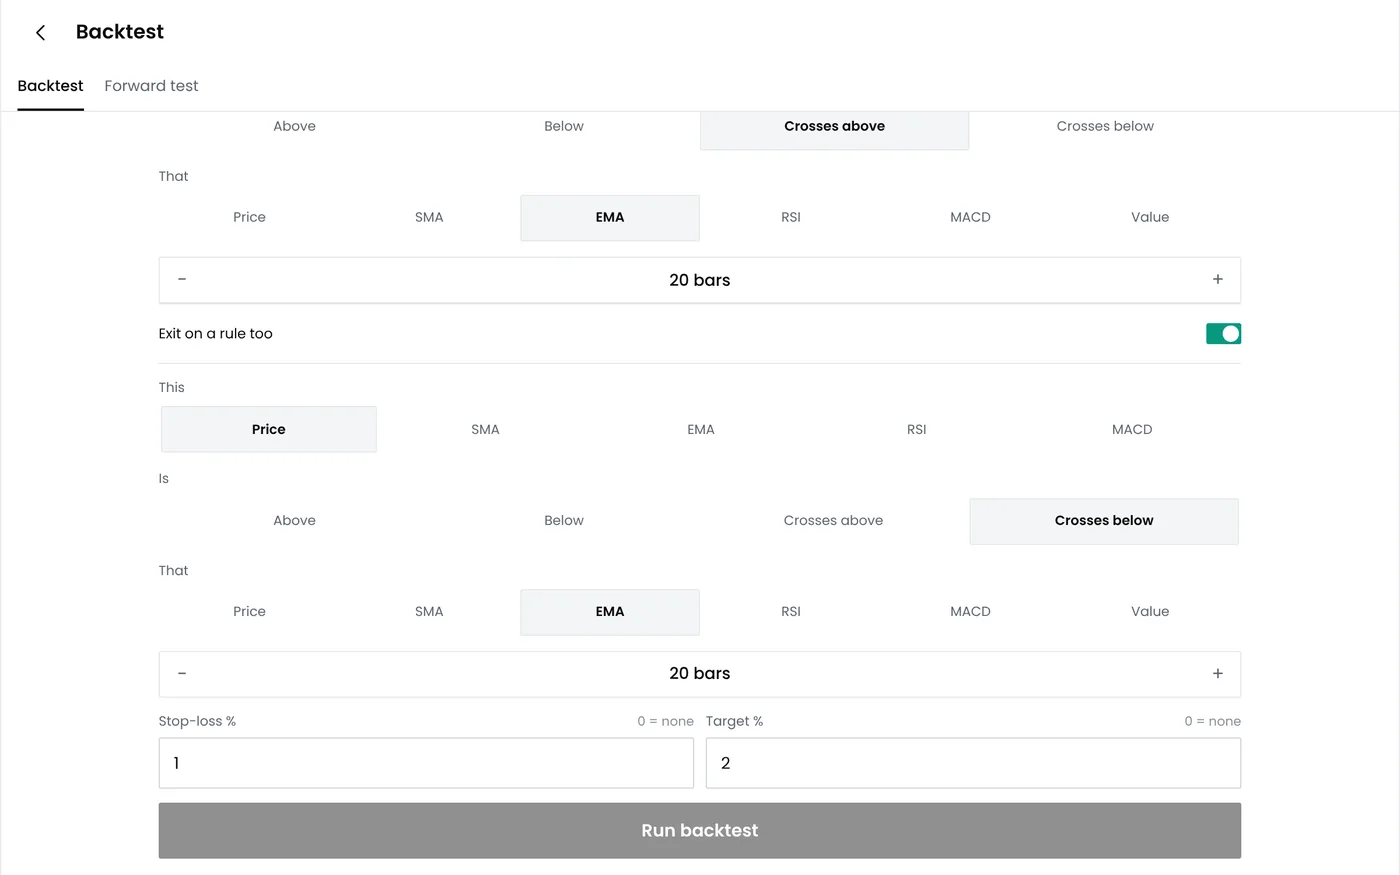
Step 2. Add the stop and filters
Set the percentage stop, the event-day filter and, if you use it, the zero-line condition.
Step 3. Backtest it
Run the rules in backtesting on five years of data with costs and slippage on, then change one setting at a time.
Step 4. Paper trade it
Run the strategy on live prices with virtual money until it has taken several trades, and compare the fills with the backtest.
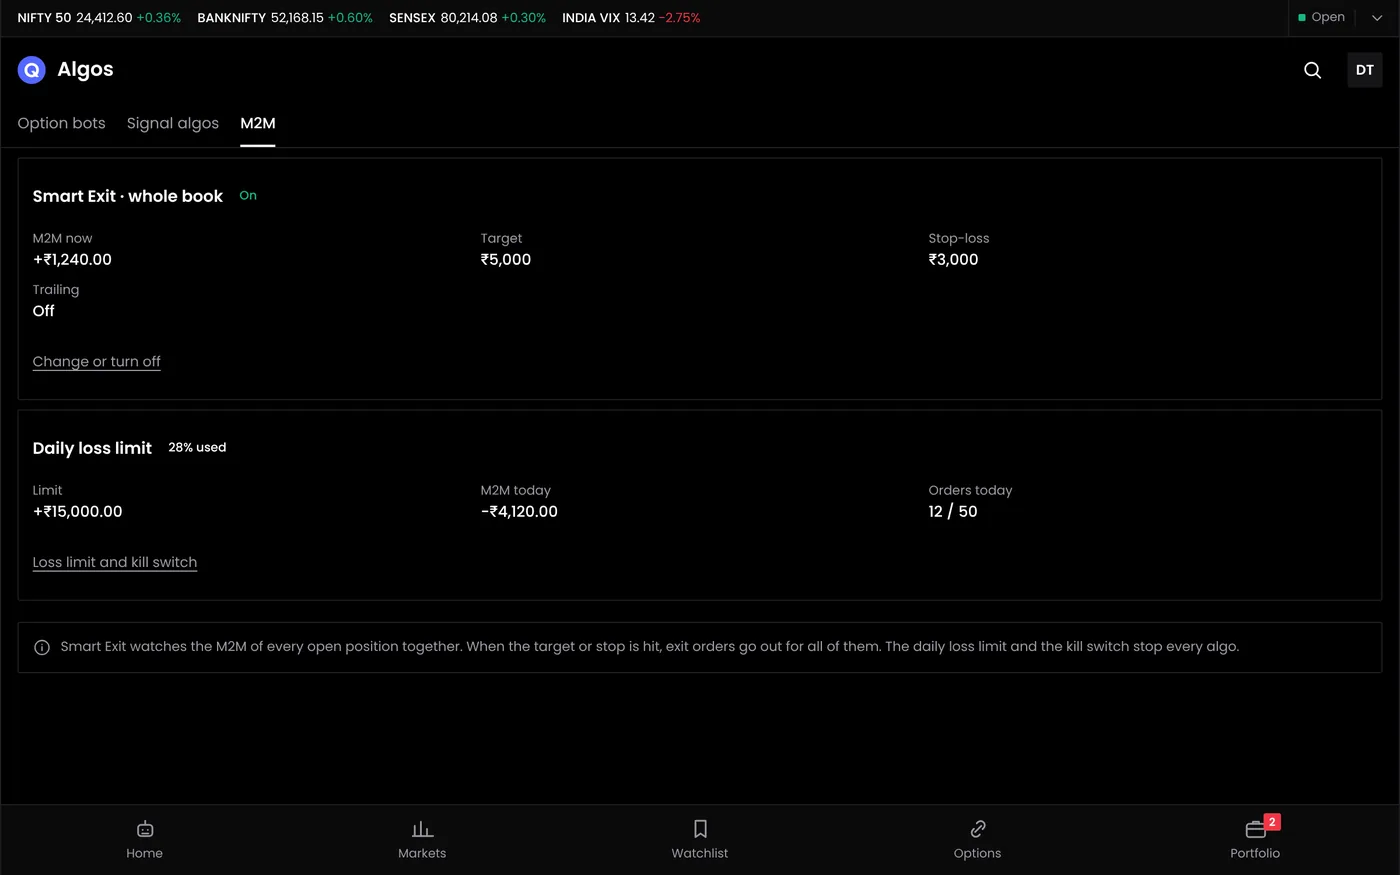
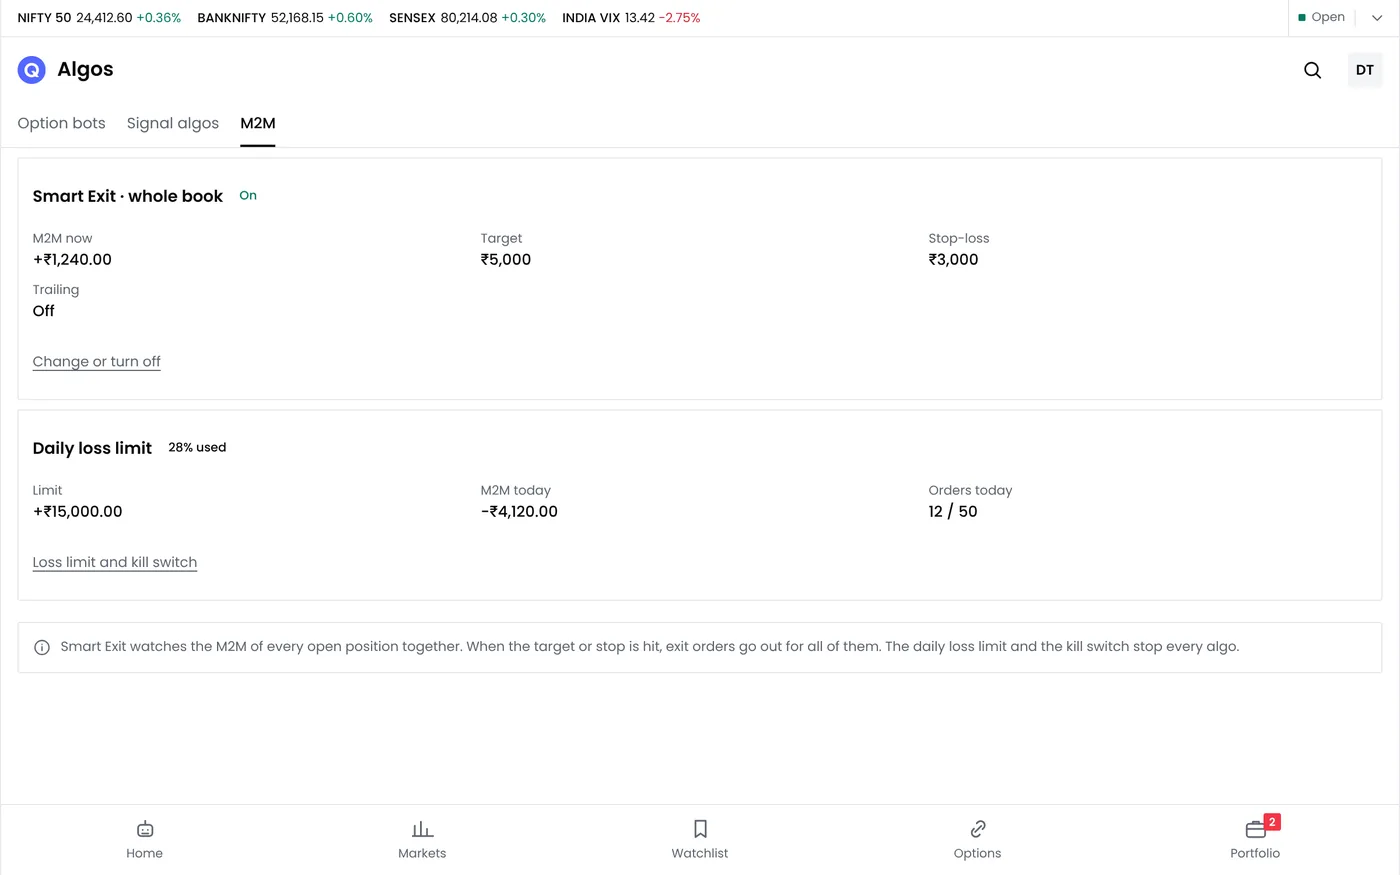
Step 5. Set the account limit
Set the daily MTM loss limit before going live. The limit squares off every position when it is hit.
Step 6. Deploy the bot
Connect your broker, choose the strategy and lots, confirm the limits and deploy. The bot checks the signal each session and manages the exits.
Step 7. Monitor and pause
Review the trades each week and use Pause all to stop every bot at once if the market does something the rules did not plan for. Orders go through your connected broker under the requirements applicable to your strategy and account; a named example is not a claim of strategy approval.
When to stop trading the strategy
Decide in advance what would make you pause the strategy, while you can still judge it calmly. Common limits are a losing streak longer than the longest one in the backtest, a drawdown more than about one and a half times the backtest's worst, or a change in the market's behaviour, such as months of tight ranges. Pausing is not the same as abandoning: review the trades, compare them with the backtest's, and restart only if the differences are explained.
Common mistakes
- Expecting MACD to catch tops and bottoms. It confirms turns after they happen.
- Trading every cross in a range. Use a filter, and test whether it helps.
- Exiting on the cross only. Test faster exits; the opposite cross can give back most of a move.
- Sizing by margin. Size from the loss at the stop.
- Forgetting rollover. A trend held through expiry costs a second round trip.
- Tuning the settings to the last year. Keep the defaults unless several years of tests support a change.
Pre-trade checklist
- The signal is on a closed daily candle.
- The filter, if used, agrees with the trade.
- No scheduled event falls before the next session.
- The stop is set before entry, and the size follows from it.
- The rollover date is known for a trade that may last past expiry.
- The rules were backtested with costs and tested on unseen data.
- The strategy has taken several trades in paper trading.
Start your free trial
Connect your broker, build a strategy and test it on paper before a single live order goes out.
Frequently asked questions
What are the best MACD settings?
The standard 12, 26, 9 is the most widely used. Faster settings react sooner with more false signals; slower settings react later with fewer.
Is MACD a leading or lagging indicator?
Lagging. It is built from moving averages, so it confirms trends after they begin.
Can I use MACD for intraday trading?
Yes, on intraday candles such as 15-minute charts, ideally with a filter such as VWAP or the daily MACD, and with all trades closed before the end of the session.
What does a MACD crossover mean?
When the MACD line crosses above the signal line, short-term momentum is strengthening relative to its recent average. A cross below means it is weakening.
Should I trade MACD crosses below zero?
A bullish cross below zero marks a fall slowing down, which is the weaker kind of buy signal. Many trend rules skip it and wait for MACD to cross zero, accepting a later entry for fewer false starts.
Does a MACD strategy work on weekly charts?
The rules work on any timeframe. On weekly candles the standard settings cover about three and six months, so signals are rare, often only a few a year, and each trade lasts months. Positional traders often take the direction from the weekly MACD and the timing from the daily one.
How long does a MACD trend trade last?
On daily candles, from a few sessions for failed signals to several weeks or months for trades that catch a trend. The longest trades usually make most of the strategy's gains.
Related guides
- MACD indicator: the lines, histogram and settings, step by step
- Moving average crossover strategy: trend rules built on two averages
- Supertrend strategy: an ATR-based trend line and trailing stop
- ADX strategy: measuring trend strength to filter signals
- Trailing stop loss: exits that follow the trend
- Technical indicators: the common indicators side by side
- Option strategy builder: build and automate the rules
Sources
- Appel, G. (2005). Technical Analysis: Power Tools for Active Investors. FT Prentice Hall
- Aspray, T. (1986). Fine-tuning the MACD. Technical Analysis of Stocks & Commodities, 4(4)
- Finance Act, 2026: STT on futures and options from 1 April 2026
- NSE: trading hours and contract specifications for Nifty futures and options