
This guide works through one model Nifty option chain with exact numbers: how OI changes, how the PCR is calculated, the two opposite ways traders read it, what the strikes with the most open interest do and do not tell you, how the picture changes during the day, and how to use OI and PCR as filters in a rule-based strategy without fooling yourself in the backtest.
Nifty PCR and open interest at a glance
| Measure | What it is | How traders use it |
|---|---|---|
| Open interest (OI) | Contracts open at a point in time | Where positions are concentrated |
| Change in OI | Contracts opened minus contracts closed since the previous close | Where new positions are being built today |
| OI PCR | Put OI ÷ call OI for one expiry | The balance of open put and call positions |
| Volume PCR | Put volume ÷ call volume for one day | The day's trading flow |
| Highest call OI strike | The call strike with the most open contracts | A possible resistance zone |
| Highest put OI strike | The put strike with the most open contracts | A possible support zone |
| Max pain | The expiry level at which option buyers would collect the least | A description, not a forecast |
Key takeaways
- The model Nifty chain for a Tuesday weekly expiry has a PCR of 1.05, with the most call OI at 25,200 and the most put OI at 24,800, 200 points either side of the index at 25,000.
- The Nifty PCR has two opposite readings. The writer view reads a high PCR as bullish; the contrarian view reads a very high PCR as a sign of fear that can come before a turn. The level alone settles nothing.
- Compare the Nifty PCR with its own range: a reading of 1.35 against a 60-session range of 0.78 to 1.42 sits 89% of the way to the top.
- The walls are not barriers. Over six days, a one-standard-deviation move in the model is 449 points, more than twice the distance to either wall.
- Change in OI shows where positions are being built now. When the model index rises 150 points by 1 pm, put writers add 1.21 lakh contracts, the Nifty PCR rises to 1.24 and both walls move up by 100 to 200 points.
- In a backtest, OI and PCR must be the figures available at the moment of each decision. End-of-day OI applied to a morning entry is look-ahead bias.
What open interest is
Every option or futures contract has a buyer and a seller. Open interest counts contracts, not traders, and each open contract has one long side and one short side. A trade changes OI in one of three ways:
| Buyer | Seller | Effect on open interest |
|---|---|---|
| Opens a new long position | Opens a new short position | Rises by one contract |
| Closes an existing short position | Closes an existing long position | Falls by one contract |
| One side opens a position | The other side closes one | No change: the position passes to a new holder |
So OI measures positions, while volume measures activity. A strike can trade lakhs of contracts in a day with no change in OI if the trades only pass existing positions from one trader to another, and OI can rise on modest volume if most trades open new positions.
Index options in India are cash-settled. When a series expires, every open contract in it is settled at its intrinsic value and its OI drops to zero. That is why the OI of the current weekly series builds through the week and disappears on expiry day, while monthly and longer series carry positions from week to week.
Platforms show OI either as a number of contracts (lots) or as units, which is contracts multiplied by the lot size of 65 for Nifty. A strike with 1.43 lakh contracts open holds 92.95 lakh units. The PCR is the same either way, because calls and puts of the same expiry share a lot size. Check which unit a screen uses before you compare figures from two sources.
How the Nifty PCR is calculated
A PCR of 1 means the same number of put and call contracts are open. Above 1, more puts are open; below 1, more calls. Three versions are in common use:
- OI PCR uses open positions. It moves slowly, because it reflects positions built over days, and it is the figure most traders mean by "the Nifty PCR".
- Volume PCR uses the day's traded contracts. If 87 put contracts trade for every 100 calls, volume PCR is 0.87. It reacts quickly but includes positions opened and closed within minutes, so it is noisier.
- Change-in-OI PCR divides the day's change in put OI by the day's change in call OI. It shows the balance of new positions, but it breaks down when either change is negative or close to zero. In that case, compare the two changes directly.
Two choices change the number you get: which expiry, and which strikes. Most option chain screens total the OI of every strike listed for the expiry you select. Some tools total only strikes within a band around the index, for example 10 strikes either side. Far out-of-the-money strikes can hold large OI in cheap options, so a band-limited PCR and an all-strike PCR for the same expiry can differ. Pick one definition and keep it, especially in a backtest. The short definition, without the worked chain, is under put call ratio meaning.
How the examples work
The numbers on this page come from one model, not from market data:
- Nifty 50 is at 25,000 at 9:30 am on a Wednesday, six days before the Tuesday weekly expiry.
- The model chain lists 11 strikes from 24,500 to 25,500, 100 points apart. The real chain lists strikes every 50 points and many more of them.
- Open interest is in lakh contracts; one contract is one lot of 65 units.
- Option prices come from the Black-Scholes model with implied volatility of 14% on every strike (no skew), an interest rate of 6.5% and six calendar days to expiry.
- Probabilities assume constant volatility and lognormal price moves. Real markets have fatter tails, so large moves happen more often than the model says.
A model Nifty option chain
| Strike | Call OI (lakh contracts) | Put OI (lakh contracts) |
|---|---|---|
| 24,500 | 0.14 | 0.37 |
| 24,600 | 0.14 | 0.49 |
| 24,700 | 0.14 | 1.04 |
| 24,800 | 0.15 | 1.51 |
| 24,900 | 0.36 | 1.17 |
| 25,000 | 1.00 | 1.07 |
| 25,100 | 1.11 | 0.37 |
| 25,200 | 1.43 | 0.15 |
| 25,300 | 0.99 | 0.14 |
| 25,400 | 0.47 | 0.14 |
| 25,500 | 0.37 | 0.14 |
| Total | 6.30 | 6.59 |
The Nifty PCR for this expiry is 6.59 ÷ 6.30 = 1.05. Call OI peaks at 25,200 with 1.43 lakh contracts and put OI peaks at 24,800 with 1.51 lakh. About 85% of the call OI sits at or above the index and about 86% of the put OI at or below it, which is the usual shape: traders sell out-of-the-money options on both sides to collect their time value.

Reading the Nifty PCR
The same PCR can be read two opposite ways, and both are in common use.
The writer view
The writer view assumes that most open index options are held short by sellers who are better informed and better capitalised than buyers, such as proprietary desks and institutions. Under that assumption, a high PCR means many puts have been written. Put writers lose if the index falls, so a market full of put writing is one where informed money expects support. A high PCR is read as bullish and a low PCR as bearish.
The contrarian view
The contrarian view treats an extreme PCR as a sign of crowding. A very high PCR can mean traders have bought puts for protection in a fearful market; a very low PCR can mean complacency. Crowded positions unwind, so extremes are read as warnings of a turn: a very high PCR as a possible bottom and a very low PCR as a possible top.
The two views disagree because OI does not record who opened each position. Every put in the PCR has a buyer and a seller, and whether rising put OI is bullish depends on which side opened the trade. The exchange totals do not show that. A widely cited study of US stock options (Pan and Poteshman, 2006) found that put-call ratios built from newly opened long positions, data that is not public, carried information about the following week's returns, and that the effect was weaker in data the public can see.
Rules of thumb and their limits
Commonly quoted rules of thumb treat a PCR between about 0.7 and 1.3 as neutral, above 1.3 as stretched on the put side and below 0.7 as stretched on the call side. These are conventions, not tested thresholds, and the normal range of the Nifty PCR drifts over months as expiry rules, lot sizes and participants change.
A sturdier reading compares the PCR with its own history:
- Record the PCR of the current weekly expiry at the same time each day, for example at 3 pm.
- Find its lowest and highest values over the last 60 sessions.
- Work out where today's value sits in that range.
Direction matters as much as level. A PCR rising from 0.9 to 1.2 over three sessions while Nifty climbs says put writing is following the market up. The same 1.2 reached by a falling PCR, as put writers close positions into a decline, describes a different market. Read the PCR with the price trend and the change in OI, never alone.
Current expiry or all expiries
The Nifty PCR of the current weekly expiry and the PCR of all expiries together answer different questions.
The current week reflects positions that settle in days: short-term writers and buyers betting on this expiry. Later expiries hold longer-dated positions, including protective puts that funds and institutions buy against their portfolios. Those puts are hedges, not bets on a fall, and they push the all-expiry PCR up.
In the model, the later expiries hold 9.20 lakh put contracts and 5.40 lakh calls. The all-expiry PCR is (6.59 + 9.20) ÷ (6.30 + 5.40) = 1.35, against 1.05 for the current week. A trader reading 1.35 as a strongly bullish writer signal would be reading the hedges. For a trade that ends on Tuesday, the current week's Nifty PCR is the relevant one; for a view over a month, the monthly series is.
Open interest by strike: support and resistance
Reading open interest strike by strike is the most common kind of open interest chart analysis. The strikes with the most open calls and puts often act as reference levels:
- The highest call OI strike above the index is read as resistance. Call writers there lose if Nifty rises above the strike, so they may sell futures or add calls to defend it, and traders watch for the index to stall below it.
- The highest put OI strike below the index is read as support, for the same reason in reverse.
In the model, those strikes are 25,200 for calls and 24,800 for puts: a band of 400 points around the index. With a PCR of 1.05, many traders would describe the expiry as range-bound between 24,800 and 25,200 with a mild bullish bias.
The walls are softer than that language suggests. With six days to expiry and implied volatility of 14%, a one-standard-deviation move in the model is 449 points, more than twice the distance to either wall. The model gives a 34.7% chance that Nifty finishes above 25,200 and a 30.9% chance that it finishes below 24,800, so about two times in three the index ends beyond one of them. Writers at a wall are not obliged to defend it. Most close or roll their positions when the index comes close, and that closing moves the wall.
Three checks make strike OI more useful:
- Look at the change, not just the level. A wall that is still growing today is stronger than one that is shrinking.
- Compare neighbouring strikes. A wall with similar OI at the strikes next to it is a zone, not a line.
- Watch what happens at the strike. If Nifty trades through the call wall and call OI there falls, writers are covering, and the next strike up becomes the new reference.
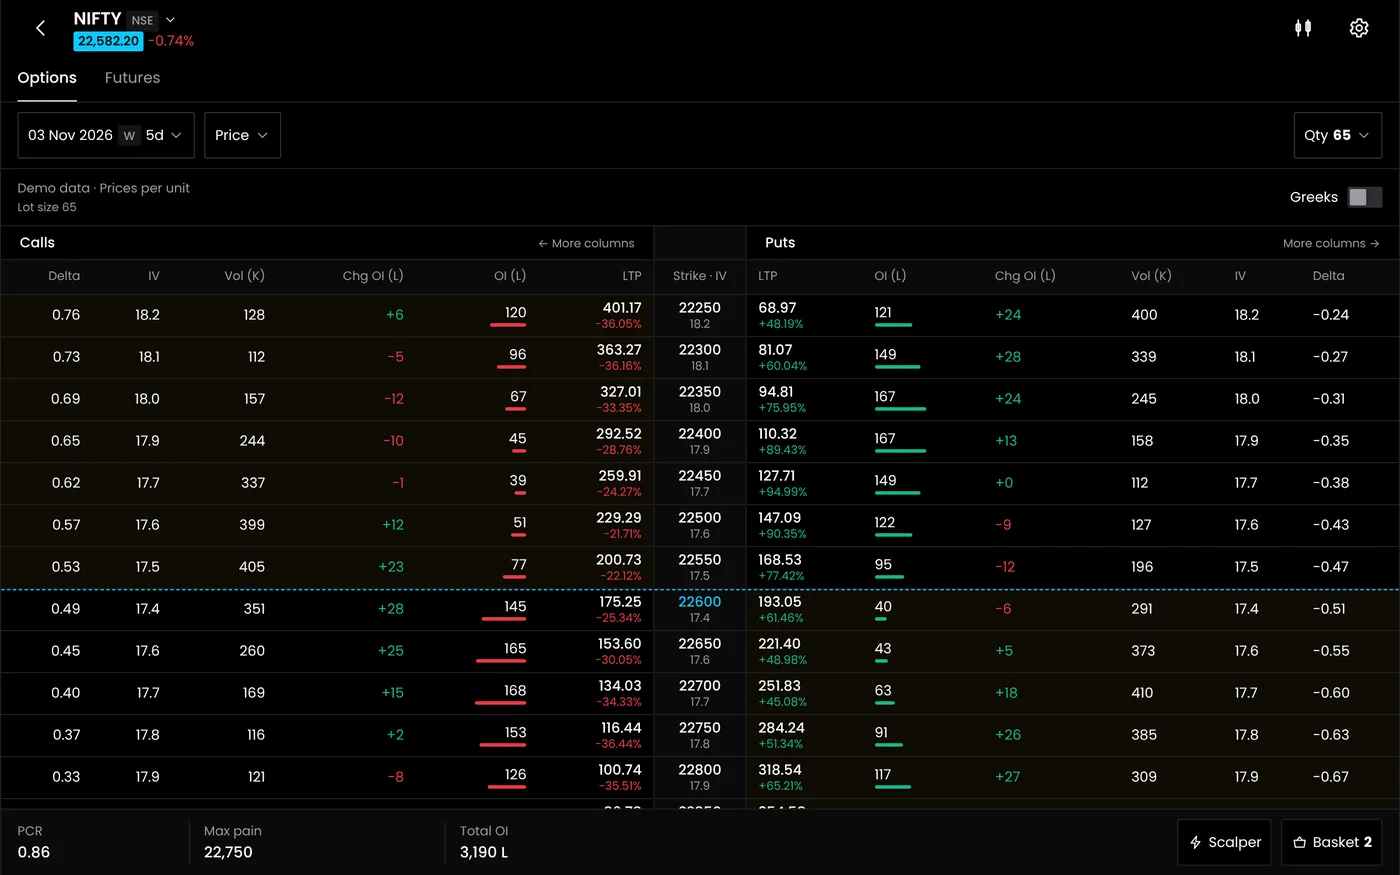
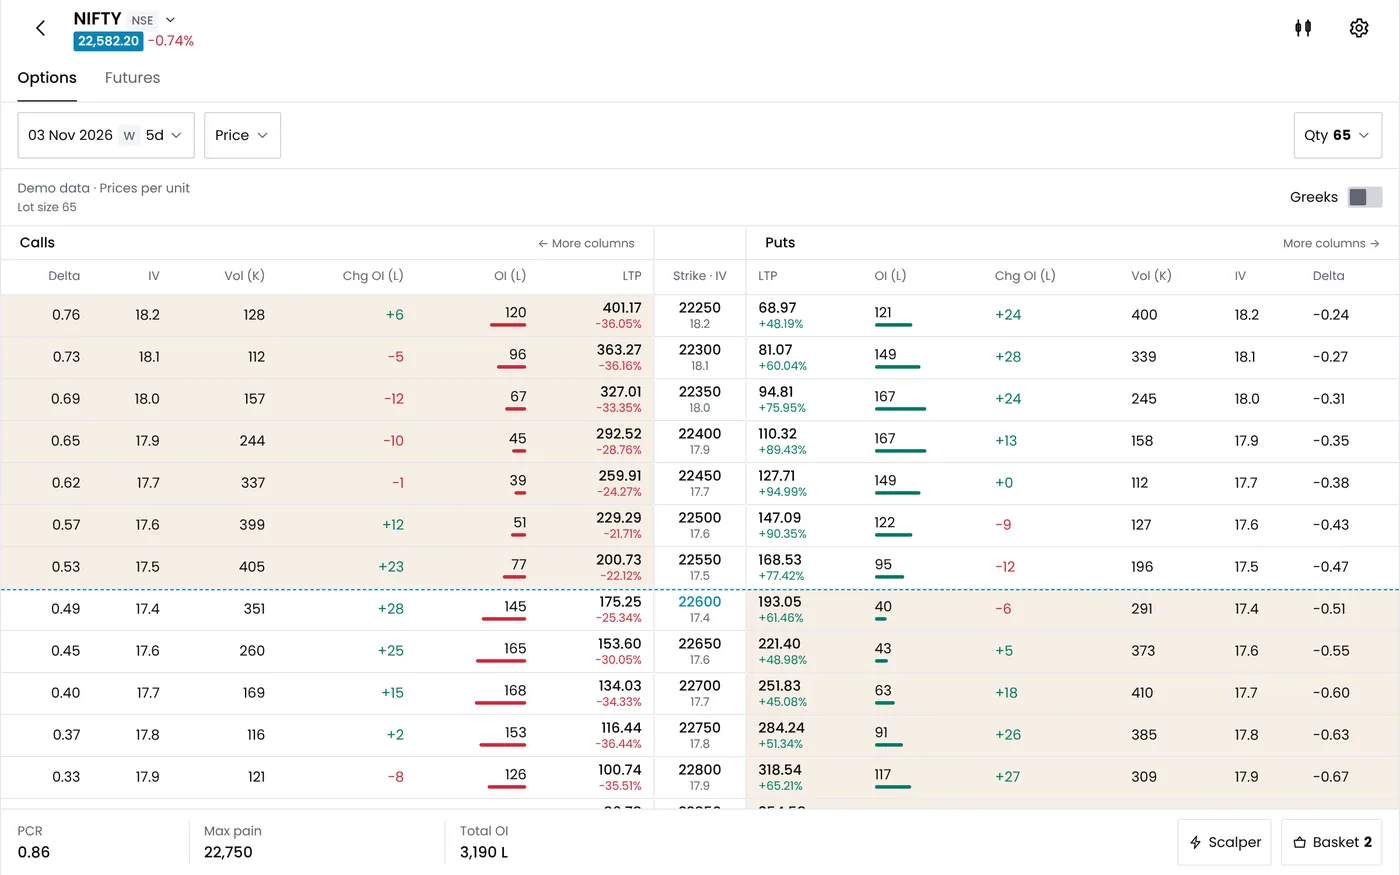
The full method for reading every column of the chain, including IV and the expected move, is in the guide to the option chain, and the Nifty option chain page shows it live.
Change in open interest during the day
Change in OI shows where positions are opened and closed today, so it reacts faster than the level. In the model, Nifty rises from 25,000 at 9:30 am to 25,150 by 1 pm, and OI changes at six strikes:
| Strike | Change in call OI | Change in put OI | Call OI at 1 pm | Put OI at 1 pm |
|---|---|---|---|---|
| 24,900 | −0.05 | +0.10 | 0.31 | 1.27 |
| 25,000 | −0.30 | +0.52 | 0.70 | 1.59 |
| 25,100 | −0.18 | +0.35 | 0.93 | 0.72 |
| 25,200 | −0.12 | +0.20 | 1.31 | 0.35 |
| 25,300 | +0.38 | +0.04 | 1.37 | 0.18 |
| 25,400 | +0.27 | 0.00 | 0.74 | 0.14 |
| All 11 strikes | 0.00 | +1.21 | 6.30 | 7.80 |
Reading the table:
- Call writers at 25,000 to 25,200 are covering. Their calls lost money as the index rose, and 0.65 lakh contracts closed.
- New call writing has moved up. 0.65 lakh contracts opened at 25,300 and 25,400, so total call OI is unchanged while its centre has shifted 100 to 200 points higher.
- Put writers are following the market up. 1.21 lakh new put contracts opened, 0.87 lakh of them at 25,000 and 25,100, just below the index.
The walls have moved. The most call OI is now at 25,300 (1.37 lakh) and the most put OI at 25,000 (1.59 lakh). The Nifty PCR has risen from 1.05 to 7.80 ÷ 6.30 = 1.24. Under the writer view this is a bullish shift: put writers are willing to sell protection 150 points below the index, and call writers have given ground. The day's change-in-OI PCR cannot be calculated, because total call OI did not change; this is the case where comparing the two changes directly works better than a ratio.
The table also shows how a morning reading can mislead by the afternoon. A trader who sold the 25,200 call at 9:30 am because "25,200 is resistance" now holds a position against a wall that has started to move.
Price and open interest together
For Nifty futures, and for the total OI of a stock or index, traders read the direction of price and the direction of OI together. Each combination has a name:
| Price | Open interest | Usual reading |
|---|---|---|
| Rising | Rising | Long buildup: new buyers are driving the move |
| Rising | Falling | Short covering: sellers are closing, and the move can fade once they are out |
| Falling | Rising | Short buildup: new sellers are driving the move |
| Falling | Falling | Long unwinding: buyers are closing |

These readings describe which side is more likely to be driving the price, since every new contract still has a buyer and a seller. They work best on futures, where one contract per expiry carries the whole position. For options, apply the same logic strike by strike, as in the change-in-OI table above. The full method, with examples for stocks and indices, is in the guide to OI buildup analysis.
Delta-weighted open interest
A contract count treats every option the same, but a far out-of-the-money option moves much less with the index than one at the money. Delta-weighted OI multiplies each strike's OI by its delta, the change in the option's price for a one-point move in Nifty, to show how much index exposure the open positions carry.
In the model, at 9:30 am on Wednesday:
- The 25,200 call has a delta of 0.35, so its 1.43 lakh contracts count as 0.50 lakh futures-equivalent contracts.
- The 24,800 put has a delta of −0.30, so its 1.51 lakh contracts count as 0.45 lakh.
- Across the chain, delta-weighted call OI is 2.62 lakh and delta-weighted put OI is 2.41 lakh.
The delta-weighted PCR is 2.41 ÷ 2.62 = 0.92, against 1.05 by contract count. The put positions sit further from the money than the call positions, so they carry less exposure per contract: by count there are more puts, by exposure the calls weigh more. Neither figure is right in general, but when two strikes carry similar OI at very different distances from the index, the delta-weighted figure is the fairer comparison.
Max pain and the PCR
Max pain is the expiry level at which the options open today would pay their buyers the least in total, and so cost their writers the least. It is worked out from the same OI by strike. In the model chain, max pain is 25,000: if Nifty settled there, call and put buyers together would collect less than at any other strike.
Some traders expect the index to drift towards max pain into expiry. The evidence is mixed, and max pain moves as OI changes. After the 1 pm shift in the model, max pain is still 25,000, but the total payout at 25,100 is now within 1% of it, as the put writing at 25,000 and 25,100 pulls the comfortable zone up with the index. Use it as a description of where writers are most comfortable, not as a target. The short definition is under max pain meaning.
The Nifty PCR through the expiry week
With weekly expiries on Tuesdays, the current series goes through the same cycle every week:
- Wednesday, the day after an expiry. The next weekly series becomes the nearest expiry. Its OI is still small, so the PCR can swing on a few lakh contracts.
- Thursday and Friday. Writers build positions at strikes either side of the index. The PCR settles and the walls form.
- Monday. Positions concentrate near the money. The walls are now close to the index and react quickly to moves.
- Tuesday, expiry day. Writers close or roll positions through the session, OI at strikes near the index can fall sharply, and the PCR can swing either way. At settlement, all of the series' OI goes to zero.
On the last Tuesday of the month, the current week is also the monthly series, which carries positions opened weeks earlier. Its OI is larger and its PCR steadier. Many traders switch to the next week's PCR during expiry day, because the expiring series is about to disappear.
Using OI walls to choose strikes: a worked example
The most direct use of strike OI is choosing where to sell. Take an iron condor on the model chain at 9:30 am on Wednesday, with 100-point wings, placed either at the walls or one strike beyond them:
| At the walls | Beyond the walls | |
|---|---|---|
| Puts | Sell 24,800 at ₹87.39, buy 24,700 at ₹60.30 | Sell 24,700 at ₹60.30, buy 24,600 at ₹40.12 |
| Calls | Sell 25,200 at ₹106.21, buy 25,300 at ₹75.48 | Sell 25,300 at ₹75.48, buy 25,400 at ₹52.01 |
| Credit per lot | ₹3,758 | ₹2,838 |
| Maximum loss per lot | ₹2,742 | ₹3,662 |
| Break-evens | 24,742 and 25,258 | 24,656 and 25,344 |
| Chance of finishing in profit | 43.4% | 55.6% |
Selling at the walls collects more and risks less per lot, but its break-evens sit well inside the 449-point one-standard-deviation move, so the model gives it less than an even chance. Moving one strike beyond the walls cuts the credit by ₹920, adds ₹920 to the worst case and lifts the chance of profit to 55.6%. Neither version has an edge in the model, because model prices are fair by construction. Any edge has to come from the walls holding more often than the model expects, and only a backtest on real OI can show whether they do.
What OI adds is a reason to choose one set of strikes over another and a rule for leaving. If Nifty trades through a short strike's wall and OI at that strike starts falling, the writers who formed the wall are covering, and the position has lost its premise. The rules, adjustments and full payoff of the structure are in the iron condor strategy guide, and the one-sided versions are the bear call spread strategy and the bull put spread strategy.
Using the Nifty PCR in rule-based strategies
Because OI and PCR are numbers, they can be written into rules. Some examples of filters, each of which needs testing before use:
- Range filter: take bullish setups only when the 3 pm PCR is in the upper half of its 60-session range and higher than five sessions ago; take bearish setups only in the lower half and falling.
- Wall filter: sell options only at strikes beyond the highest-OI strike on that side, and at least a set distance from the index, for example half of the expected move to expiry.
- Confirmation filter: before a bullish entry, require put OI to have risen by more than call OI since the open.
- Exit rule: close a short call if Nifty trades above its call wall and call OI at that strike has fallen by more than 10% since entry.
The hard part is the data. Intraday OI is updated at intervals rather than with every trade, and the end-of-day figure is known only after the close. A backtest that uses each day's final OI to decide a 9:30 am entry knows something the trader could not have known. That is look-ahead bias, and it makes OI filters look far better than they are. Store OI snapshots at the times your rules use them, test across at least a year of weekly expiries, and check the rule on data it was not tuned on with walk-forward testing.
Limits of the Nifty PCR and open interest
- OI does not show who opened each position. Every interpretation rests on an assumption about whether buyers or writers drove the trades.
- Hedges look like bets. A fund buying puts to protect a portfolio raises put OI without any view that the index will fall.
- Spreads add OI at several strikes at once. A bull put spread adds a short put at one strike and a long put at another, and both count in the PCR.
- Walls move. OI at a strike can change by lakhs of contracts within an hour as writers roll positions.
- Expiry distorts the picture. Near the Tuesday close, the expiring series empties and its PCR loses meaning.
- No timing. OI shows where positions are, not when the market will move.
Use OI and PCR as context for a decision that rests on price, volatility and risk limits.
Nifty, Bank Nifty and Sensex PCR
Since SEBI's October 2024 framework allowed one weekly index expiry per exchange, the three main Indian index option chains settle on different cycles:
- Nifty 50 has weekly expiries on Tuesdays on NSE, so its current-week PCR reflects positions that settle within days.
- Bank Nifty has monthly expiries only, on the last Tuesday of the month. Its PCR reflects positions built over a month and moves more slowly; see the Bank Nifty option chain.
- Sensex has weekly expiries on Thursdays on BSE. Its PCR comes from BSE's chain and has its own normal range.
Do not compare PCR levels across indices. Each has its own participants, hedging demand and range, so a 1.2 on Bank Nifty and a 1.2 on Nifty do not mean the same thing.
Common mistakes reading the Nifty PCR and open interest
- Reading the level without the range. A Nifty PCR of 1.3 can be high in one quarter and ordinary in the next.
- Mixing expiries. The all-expiry PCR includes long-dated hedges; for a weekly trade, use the current week.
- Treating walls as barriers. In the model, Nifty finishes beyond one of the walls about two times in three.
- Ignoring the change in OI. A wall that shrinks as the index approaches it is being abandoned.
- Comparing units. Contracts and units differ by the lot size, so figures from two screens cannot be compared until both are in the same unit.
- Backtesting with end-of-day OI. Morning decisions need morning data.
- Trading one number. OI and PCR describe positions; entries and exits still need price levels, stops and a size that fits the account.
Where to see open interest and the Nifty PCR in QuantPower
QuantPower's advanced option chain, included in every plan, shows OI, change in OI, IV, Greeks and PCR for each strike, with prices from your connected broker account. Futures analysis shows price and OI changes for index and stock futures with the buildup type, and the stock scanner searches F&O contracts for open interest changes as they happen. When a rule is ready, the option strategy builder can choose strikes by delta, set stops on every leg and run the strategy as a bot with a daily MTM limit for the whole account. The full feature list is on the option trading app page.
Start your free trial
Connect your broker, build a strategy and test it on paper before a single live order goes out.
Frequently asked questions
What is a good Nifty PCR?
There is no single good value. Rules of thumb treat about 0.7 to 1.3 as neutral, but the normal range drifts over months. A more useful test is where today's PCR sits in its own range over the last 60 sessions, read with the price trend and the change in open interest.
How is the Nifty PCR calculated?
Divide the total put open interest by the total call open interest for the same expiry. In the model chain on this page, 6.59 lakh put contracts ÷ 6.30 lakh call contracts gives 1.05. Volume PCR uses the day's traded contracts instead of open positions.
Should I use the PCR of the current expiry or of all expiries?
For a trade that ends this week, use the current weekly expiry, because it reflects the positions that settle soonest. The all-expiry figure includes long-dated protective puts held as hedges, which push it higher: in the model it reads 1.35 against 1.05 for the current week.
What is the difference between OI PCR and volume PCR?
OI PCR measures positions still open, so it moves slowly and reflects the build-up over days. Volume PCR measures the day's trading, including positions opened and closed within minutes, so it is noisier. Many traders use OI PCR for the bias and volume PCR as a check on the day's flow.
Why does the Nifty PCR swing on expiry day?
On a Tuesday expiry, writers close or roll positions in the expiring series, and OI at strikes near the index can fall sharply. Small changes at one or two strikes then move the ratio a lot, and all of the series' OI goes to zero at settlement. Many traders switch to the next week's PCR during the day.
What is the difference between open interest and volume?
Volume counts every contract traded in a period, whether it opens or closes a position. Open interest counts the contracts still open at the end of it. A strike can trade heavily with no change in OI if the trades only pass existing positions from one trader to another.
Can a Nifty PCR rule be backtested and automated?
Yes, if the backtest uses the OI and PCR that were available at the moment of each decision. Using end-of-day OI to time an intraday entry is look-ahead bias. Once a rule holds up on data it was not tuned on, it can run with fixed entries, stops and a daily loss limit.
Related guides and terms
- Nifty option chain, Bank Nifty option chain, option chain and how to use the option chain
- OI buildup analysis, put call ratio meaning and max pain meaning
- Iron condor strategy, bear call spread strategy, bull put spread strategy and option selling strategies
- Option greeks, strike price selection, Nifty option trading and hero zero option trading
- Backtest trading strategies, look ahead bias, walk-forward testing and options risk management
- Glossary: Lot size meaning, expiry meaning, hedging meaning and delta meaning
Sources
- SEBI circular SEBI/HO/MRD/TPD-1/P/CIR/2024/132: Measures to strengthen the equity index derivatives framework, 1 Oct 2024 (one weekly index expiry per exchange)
- NSE: Option chain
- NSE: Equity derivatives contract specifications
- Pan, J. and Poteshman, A. M. (2006). The Information in Option Volume for Future Stock Prices. Review of Financial Studies, 19(3), 871–908
- Hull, J. C. Options, Futures, and Other Derivatives. Pearson