
This guide reads one model Nifty option chain from left to right with exact numbers: how to pick the expiry, find the at-the-money strike, split prices into intrinsic and time value, read open interest and implied volatility, use the Greeks, work out the expected move, check liquidity, and turn what the chain shows into a choice of strikes for a trade.
Option chain at a glance
| Part of the chain | What it shows | What to do with it |
|---|---|---|
| Expiry | Which contract cycle the chain belongs to | Read the expiry that matches how long you plan to hold |
| Strike | The price at which the option can be exercised | Find the at-the-money strike first |
| LTP, bid and ask | The last trade and the best prices to sell and buy now | Trade at the bid or ask, not the LTP |
| Volume | Contracts traded today | A sign of activity today |
| Open interest (OI) | Contracts still open | Where positions are concentrated |
| Change in OI | Positions added or closed today | Whether traders are building or leaving |
| Implied volatility (IV) | The volatility the price implies | Whether options are cheap or expensive |
| Greeks | Delta, gamma, theta and vega | How the price reacts to the index, time and IV |
Key takeaways
- Read the expiry first: the same strike costs very different amounts for 5, 12 or 40 days.
- Find the at-the-money strike, then read outwards. Strikes below it are in the money for calls and out of the money for puts, and the reverse above it.
- An option's price is intrinsic value plus time value. Only time value decays.
- High open interest marks where positions are, not where the market must stop. The change in OI matters more than the total.
- The at-the-money straddle price is a quick estimate of the move the market expects by expiry.
- Check the bid-ask spread before you trade. A wide spread costs more than brokerage on most option trades.
How an option chain is laid out
Most chains put calls on the left, puts on the right and strikes in the centre column. Each row is one strike. The columns mirror each other: call OI on the far left and put OI on the far right, with prices nearest the strike. In-the-money options are usually shaded: calls with strikes below the current price and puts with strikes above it.
Above the chain you choose the underlying and the expiry, and the chain shows the spot price, the futures price and often the put-call ratio and max pain. Index options in India are European-style and cash-settled: they can be exercised only at expiry and settle in cash on the final settlement price, so what the chain shows at expiry is the payoff you get.
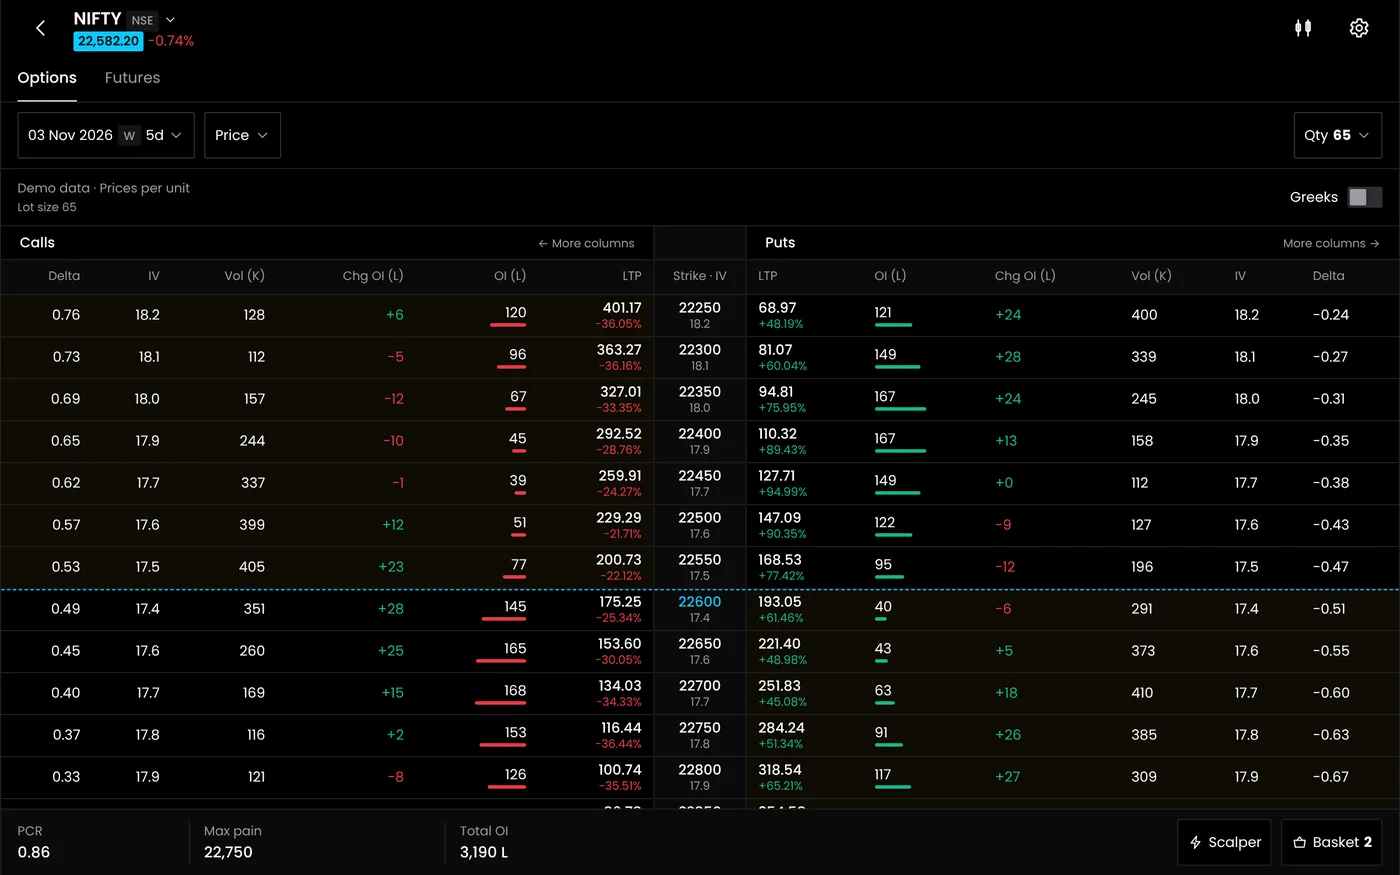
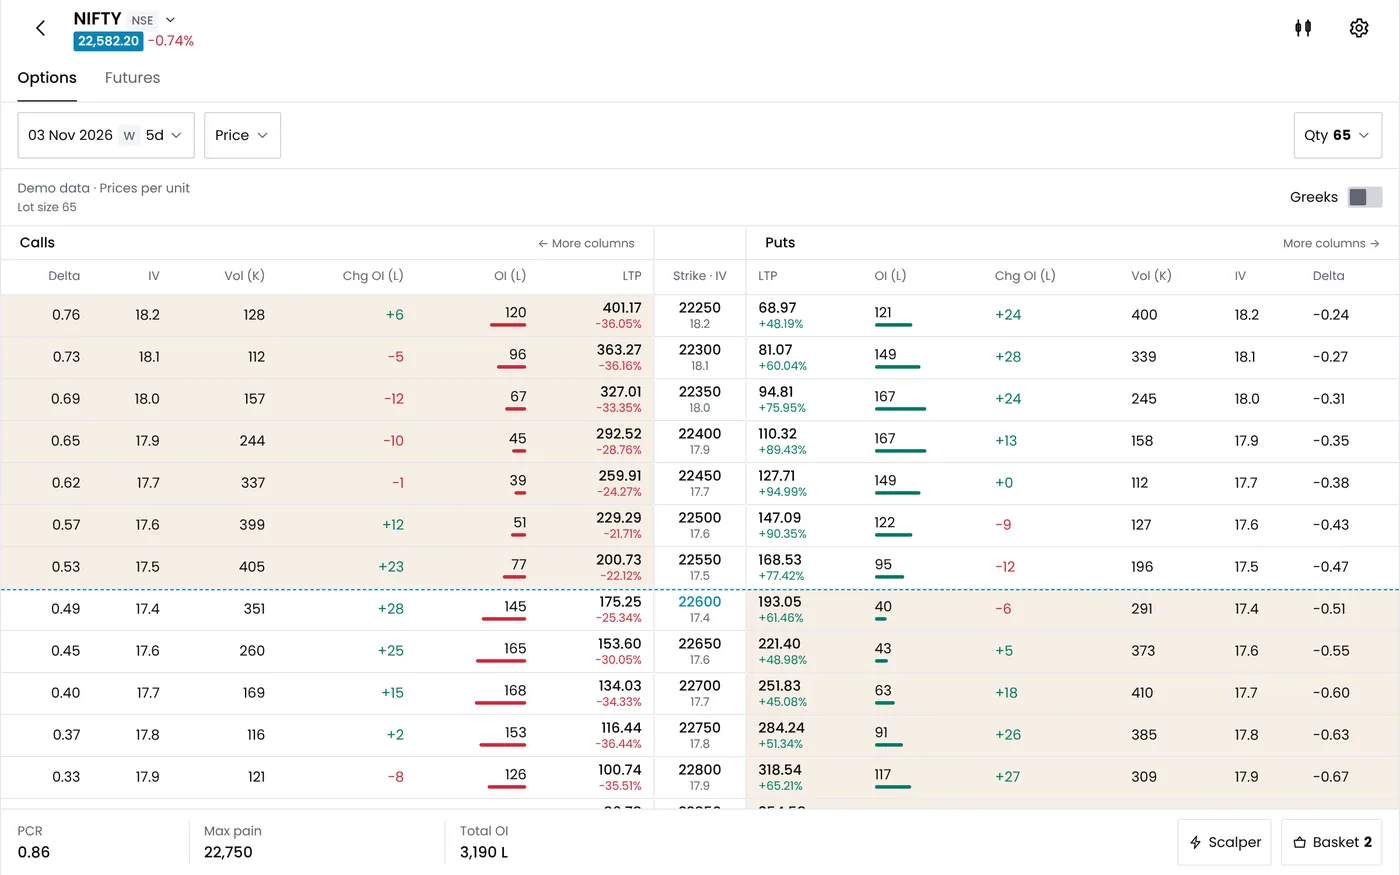
The model chain used in this guide
The numbers below are model prices from the Black-Scholes formula with Nifty at 25,000, 12 days to expiry, IV of 14% at every strike and an interest rate of 6.5%, rounded to the 5-paise tick. A Nifty lot is 65 units. Real chains show a volatility smile, so live prices away from the money differ.
| Call delta | Call price | Strike | Put price | Put delta |
|---|---|---|---|---|
| 0.72 | ₹466.15 | 24,700 | ₹113.40 | −0.28 |
| 0.66 | ₹398.30 | 24,800 | ₹145.35 | −0.34 |
| 0.60 | ₹336.35 | 24,900 | ₹183.20 | −0.40 |
| 0.54 | ₹280.50 | 25,000 | ₹227.10 | −0.46 |
| 0.48 | ₹230.85 | 25,100 | ₹277.30 | −0.52 |
| 0.41 | ₹187.50 | 25,200 | ₹333.70 | −0.59 |
| 0.35 | ₹150.10 | 25,300 | ₹396.10 | −0.65 |
Step 1: choose the expiry
Nifty options expire every Tuesday on NSE, with a monthly contract on the last Tuesday of the month. Sensex options expire every Thursday on BSE. Bank Nifty, FinNifty and stock options have monthly expiries only. When an expiry day is a holiday, the contracts expire on the trading day before; the nifty expiry date calendar lists every date.
The expiry changes the price more than most traders expect. The same at-the-money strike, at the same 14% IV:
| Days to expiry | 25,000 call | 25,000 put | Straddle | Expected move (one standard deviation) |
|---|---|---|---|---|
| 5 | ₹174.70 | ₹152.45 | ₹327.15 | ±410 points |
| 12 | ₹280.50 | ₹227.10 | ₹507.60 | ±635 points |
| 40 | ₹554.70 | ₹377.25 | ₹931.95 | ±1,159 points |
Time value grows with roughly the square root of time: 40 days is eight times 5 days, but the straddle costs less than three times as much. That is why options lose value fastest in the last days before expiry. Read the expiry that matches your plan: a trade you will hold for a week belongs in a weekly or the next monthly contract, not in an expiry two days away.
Step 2: find the at-the-money strike
The at-the-money (ATM) strike is the one closest to the current price, 25,000 in the model. Strikes are 50 points apart for Nifty. From the ATM strike:
- Calls below it and puts above it are in the money (ITM): they have intrinsic value.
- Calls above it and puts below it are out of the money (OTM): their price is all time value.
Use the futures price rather than the spot price when the two differ by more than a strike gap, because option prices track the forward price of the index. Near expiry they converge.
Step 3: read the prices
The last traded price (LTP) is the price of the last trade, which may be minutes old for a quiet strike. The bid is the best price someone will pay you now, and the ask is the best price someone will sell at. You buy at the ask and sell at the bid.
Every option price splits into two parts:
| Option | Price | Intrinsic value | Time value |
|---|---|---|---|
| 24,800 call (ITM) | ₹398.30 | ₹200.00 | ₹198.30 |
| 25,000 call (ATM) | ₹280.50 | ₹0.00 | ₹280.50 |
| 25,200 call (OTM) | ₹187.50 | ₹0.00 | ₹187.50 |
| 25,200 put (ITM) | ₹333.70 | ₹200.00 | ₹133.70 |
Time value is highest at the money and falls away from it. It is the part that decays to zero by expiry. A buyer needs the index to move far enough to beat it; a seller earns it if the index does not.
Calls and puts at the same strike are linked. Put-call parity says the call minus the put equals the index minus the present value of the strike. At 25,000: ₹280.50 − ₹227.10 = ₹53.40, and 25,000 − 25,000 × e^(−0.065 × 12/365) is ₹53.37. If the two sides of a live chain break this by more than costs, one of the quotes is stale or the futures price differs from the spot.
Step 4: read volume and open interest
Volume counts contracts traded today. Open interest counts contracts open now: a new buyer and a new seller create one contract of OI, and it falls when they close. High volume with little change in OI means traders are swapping positions. Rising OI means new positions are being built.
In the model OI chain, the most call OI sits at 25,200 and the most put OI at 24,800, the put-call ratio is 1.05 and max pain is 25,000. Traders read the strike with the most call OI as resistance, because call sellers there lose if the index rises past it, and the strike with the most put OI as support.

Three cautions apply. OI shows where positions are, not who holds them or why: a large put OI can be hedges against shares. OI walls move during the day as positions are rolled. And on expiry day OI collapses as positions close, so the walls lose meaning. The Nifty PCR guide works through how the ratio and the walls change during a session.
Step 5: read implied volatility
Implied volatility is the volatility that, put into the pricing model, gives the option's market price. An IV of 14% means the market prices the index to move about 14% a year, or about 0.73% a day (14% ÷ √365), one standard deviation.
IV is what makes an option cheap or expensive, more than its rupee price. The same 25,000 call with 12 days left costs ₹244.50 at 12% IV, ₹280.50 at 14% and ₹316.50 at 16%. A rise of two points of IV adds ₹36 to the price, about ₹2,340 a lot, with no move in the index. Its vega of 18.00 says the same thing: about ₹18 per point of IV.
Live chains rarely show one IV across strikes. Out-of-the-money puts usually carry higher IV than out-of-the-money calls, because traders pay more for protection against a fall. That pattern is the skew. IV also tends to rise before events such as the RBI policy, the Budget or results, and to fall sharply after them, which can cut an option's price even when the index moves your way.
Step 6: read the Greeks
| Greek | 24,800 call (ITM) | 25,000 call (ATM) | 25,200 call (OTM) | What it means for one lot of 65 |
|---|---|---|---|---|
| Delta | 0.66 | 0.54 | 0.41 | The ATM call gains about ₹35 for a 1-point rise |
| Theta a day | −₹12.55 | −₹12.85 | −₹12.11 | The ATM call loses about ₹835 a day to time |
| Vega | 16.60 | 18.00 | 17.66 | One point of IV is worth about ₹1,170 a lot |
| Gamma | 0.00058 | 0.00063 | 0.00061 | Delta rises about 0.06 for a 100-point rise |
Delta is also a rough guide to the chance of finishing in the money: the 25,200 call's delta of 0.41 says the market gives it a little under even odds. Delta changes as the index moves (gamma), so a position's risk grows fastest near the money and near expiry.

Step 7: estimate the expected move
There are two quick ways to read the expected move from a chain.
- The straddle. Add the ATM call and put: ₹280.50 + ₹227.10 = ₹507.60. The market prices a move of about ±508 points by expiry, so 24,492 to 25,508.
- The IV formula. Expected move = index × IV × √(days ÷ 365). 25,000 × 0.14 × √(12 ÷ 365) = ±635 points, one standard deviation.
The straddle gives about 0.8 of the one-standard-deviation move, because it prices the average size of the move rather than its standard deviation. If returns were normal, the index would end inside ±635 points about two times in three. Real markets have more large moves than a normal curve, so treat the range as a guide.
Step 8: check liquidity before you trade
A chain can show a price at every strike, but only some strikes trade well. Before you trade:
- Bid-ask spread. At an ATM Nifty strike the spread is often 5 to 10 paise. On a far strike or a stock option it can be several rupees. A spread of ₹2 on a ₹40 option is 5% of the price, lost the moment you enter.
- Volume and OI. Prefer strikes with steady volume and OI in thousands of contracts, so you can exit in a hurry.
- Depth. Check that the quantity at the bid and ask covers your order. Large orders can be split; exchanges also set a freeze quantity above which an order must be sliced.
Use limit orders on options rather than market orders, and widen the limit only as far as you are willing to pay. If a limit order does not fill within a minute or two, the strike is probably less liquid than its OI suggests; move to a nearer strike rather than chasing the price.
Putting it together: choosing strikes
The same chain gives a different choice for each view. All figures are for one lot of 65 at expiry.
| View | Trade from the chain | Cost or credit | Best case | Worst case | Break-even |
|---|---|---|---|---|---|
| Up, sharply | Buy the 25,000 call at ₹280.50 | ₹18,232.50 paid | No cap | ₹18,232.50 | 25,280.50 |
| Up, to about 25,300 | Buy 25,000 call, sell 25,300 call: ₹130.40 net | ₹8,476 paid | ₹11,024 | ₹8,476 | 25,130.40 |
| Range 24,750 to 25,250 | Iron condor: sell 24,750 put and 25,250 call, buy 24,500 put and 25,500 call: ₹139.25 net | ₹9,051.25 received | ₹9,051.25 | ₹7,198.75 | 24,610.75 and 25,389.25 |
| Range, quiet | Sell the 25,000 straddle: ₹507.60 | ₹32,994 received | ₹32,994 | No cap | 24,492.40 and 25,507.60 |
The chain tells you what each view costs and what the market expects. It does not tell you which view is right. Compare the break-evens with the expected move: the straddle's break-evens sit at about ±508 points, inside the ±635-point one-standard-deviation range, so on these numbers a short straddle held to expiry loses about two times in five. Model any of these in the option profit calculator.
Calls and puts by moneyness
The same strike means opposite things on the two sides of the chain. With Nifty at 25,000:
| Strike | Call | Put |
|---|---|---|
| 24,800 | In the money by 200 points: ₹200 of intrinsic value | Out of the money: all time value |
| 25,000 | At the money | At the money |
| 25,200 | Out of the money: all time value | In the money by 200 points |
In-the-money options move more like the index (higher delta) and cost more. Out-of-the-money options are cheaper, move less at first and expire worthless unless the index reaches them. At-the-money options have the most time value and the most gamma, so they change fastest.
How the chain changes as expiry nears
The at-the-money option changes character in the last days. Same index, same 14% IV:
| Days to expiry | 25,000 call | Theta a day | Gamma | Delta |
|---|---|---|---|---|
| 12 | ₹280.50 | −₹12.85 | 0.00063 | 0.54 |
| 5 | ₹174.70 | −₹18.62 | 0.00097 | 0.52 |
| 1 | ₹75.35 | −₹38.79 | 0.00218 | 0.51 |
With one day left, the call costs about a quarter of its 12-day price, and its gamma is several times higher: a 100-point move now shifts its delta far more than it did with 12 days left. Out-of-the-money options collapse fastest. The 25,200 call is worth ₹187.50 with 12 days left but only ₹13.55 with one day left, because the index has little time to reach it.
On the chain this shows up in three ways near expiry. Far strikes trade at a few rupees or paise and their spreads widen. Open interest falls as traders close positions, so OI walls lose meaning on expiry day. And the at-the-money straddle shrinks to price only the move left in the session.
Reading the chain during the day
- At the open. Spreads are wider and IV often jumps after an overnight move. Wait for prices to settle before reading the chain closely.
- Through the session. Watch the change in OI at the strikes near the money. Positions added at a strike as the index approaches it tell you more than the opening totals.
- After an event. IV usually falls once the RBI policy, results or a data release is out. Option prices can drop even when the index moves the way a buyer wanted.
- Into the close. On expiry day the official close decides settlement, so the last hour can move far strikes sharply.
A worked reading of one chain
It is 10:30 am, Nifty is at 25,000 with 12 days to expiry, and you expect a rise to about 25,300 within a week.
- Expiry. A week's view belongs in the 12-day expiry, not a 5-day one that would decay too fast.
- ATM strike. 25,000. The 25,000 call has a delta of 0.54, the 25,300 call 0.35.
- Prices. The 25,000 call costs ₹280.50, all time value. A rise to 25,300 by expiry would leave it worth ₹300, barely more than its cost.
- IV. 14%, so the option is not priced for an event. A spread reduces the IV risk anyway.
- Expected move. About ±508 points by expiry: a 300-point rise is well within what the market prices.
- OI. The most call OI sits at 25,200. The view needs the index to get through it.
- Liquidity. Both strikes trade with tight spreads.
The reading points to a bull call spread rather than a bought call: buy the 25,000 call, sell the 25,300 call, for ₹130.40 net, ₹8,476 a lot, with a maximum profit of ₹11,024 at 25,300 or above. The chain priced the view; it did not confirm it.
Option chain terms
| Term | Meaning |
|---|---|
| Strike gap | The distance between strikes: 50 points for Nifty, 100 for Bank Nifty and Sensex |
| ITM, ATM, OTM | In, at or out of the money; see itm atm otm meaning |
| Intrinsic value | What the option would be worth if exercised now; see intrinsic value meaning |
| Bid-ask spread | The gap between the best buy and sell prices; see bid ask spread meaning |
| Change in OI | Contracts added or closed since the previous day |
| PCR | Put OI divided by call OI for the expiry |
| Max pain | The expiry price at which option buyers as a whole would lose the most |
| IV skew | The difference in IV between out-of-the-money puts and calls |
| Straddle | The ATM call plus the ATM put, a quick read of the expected move |
| Freeze quantity | The largest order size the exchange accepts in one order |
The strike itself is defined in strike price meaning. Most chains also let you switch between showing Greeks and showing OI, and between the current expiry and later ones.
Using the chain in a rule-based strategy
A chain read by eye becomes a set of rules when you automate it. Common rules that come straight from the columns:
- Strike by delta. Sell the call and put with a delta near 0.20, or buy the strike with a delta near 0.50, instead of a fixed number of points away. The strike then adjusts to volatility on its own.
- Strike by premium. Sell the first strike whose premium is below a set amount, such as ₹40.
- IV filter. Enter a short-premium trade only when IV is above a set level, and a long-premium trade only when it is below.
- Expected move. Place short strikes outside the straddle's break-evens.
- Liquidity filter. Skip any strike whose spread is wider than a set share of its price.
Test such rules on historical chain data before you trade them, including the spread you would have paid at each strike. The option strategy builder selects strikes by delta, premium or points and runs the rules on a broker account.
Common mistakes in reading an option chain
- Trading at the LTP. The last trade may be old. Your fill is at the bid or the ask.
- Reading the wrong expiry. A strike that looks cheap may simply expire sooner.
- Treating OI walls as fixed. They shift during the day and vanish on expiry day.
- Comparing rupee prices instead of IV. A ₹40 option can be expensive and a ₹300 option cheap.
- Ignoring the spread. On far strikes and stock options, the spread can cost more than the move you expect.
- Forgetting the lot size. Every rupee of premium is 65 rupees per Nifty lot.
- Reading one strike alone. Support from put OI means little if call OI is building just above it.
Option chains for other underlyings
The method is the same for every underlying; the details differ.
| Underlying | Lot | Strike gap | Expiries |
|---|---|---|---|
| Nifty 50 | 65 | 50 points | Weekly on Tuesday, monthly on the last Tuesday |
| Bank Nifty | 30 | 100 points | Monthly, last Tuesday |
| Sensex | Set by BSE | 100 points | Weekly on Thursday |
| Stock options | Varies by stock | Varies by price | Monthly, last Tuesday |
Stock options have wider spreads, are physically settled if held to expiry in the money, and many strikes trade rarely. For the index chains, the Nifty option chain and Bank Nifty option chain pages show a model chain you can change.
Reading the chain in QuantPower
QuantPower's chain shows LTP, IV, delta, OI, change in OI, volume, gamma, theta and vega for both sides, with the PCR, max pain and expected move above it. Calls and puts scroll sideways on their own so the strike stays in view. You can tap prices to build a basket, open it in the strategy builder to see the payoff and margin, and send it to your broker. The chain is part of every plan; see the option trading app page.
Start your free trial
Connect your broker, build a strategy and test it on paper before a single live order goes out.
Frequently asked questions
What does an option chain show?
The calls and puts of one underlying for one expiry, strike by strike, with their prices, bid and ask, volume, open interest, change in OI, implied volatility and Greeks.
Which expiry should I read on the option chain?
The one that matches how long you plan to hold the trade. Nearer expiries are cheaper and decay faster; further ones cost more and react less to each day.
What is the most important column in an option chain?
There is no single one. Price and bid-ask spread tell you what a trade costs, IV whether it is cheap, delta how it moves, and change in OI what other traders are doing today.
How do I calculate the expected move from an option chain?
Add the at-the-money call and put prices. With the 25,000 call at ₹280.50 and the put at ₹227.10, the market prices a move of about ±508 points by expiry.
How do I find support and resistance from an option chain?
Look for the strikes with the most put OI (support) and call OI (resistance), then check the change in OI today. Walls that are growing count for more than walls that are shrinking.
What is the difference between the LTP and the bid and ask?
The LTP is the price of the last trade. The bid and ask are what you can trade at now: you sell at the bid and buy at the ask.
What does an IV of 14% mean?
That the option prices the index to move about 14% a year, one standard deviation, or about 0.73% a day. For Nifty at 25,000 over 12 days, that is about ±635 points.
Related guides and terms
- Nifty PCR: the put-call ratio and open interest in detail
- Option greeks: delta, gamma, theta, vega and rho
- Implied volatility crush: why IV falls after events
- Max pain meaning: the max pain figure on the chain
- Nifty option chain and Bank Nifty option chain: model chains you can change
- How to use the option chain: the option chain screen in QuantPower
- Option trading app: the chain with live Greeks, IV and open interest
Sources
- NSE: equity derivatives contract specifications, expiry days and lot sizes from the January 2026 series
- SEBI: circular on expiry days for equity derivatives, 26 May 2025
- Model prices: Black-Scholes, Nifty 25,000, IV 14%, interest rate 6.5%, 5, 12 and 40 days