
This guide is a reference to the main options trading strategies used on Nifty and the other Indian indices. It groups them by market view, puts model numbers for one Nifty lot side by side, shows how time and implied volatility move each one, compares the pairs traders most often confuse, and covers margin, charges, events, adjustments and testing.
Options trading strategies at a glance
| Market view | Strategies that fit | Paid or received | Worst case |
|---|---|---|---|
| A strong rise, soon | Long call | Paid | The premium |
| A moderate rise | Bull call spread | Paid | The debit |
| Holds above a level | Bull put spread, short put | Received | Capped for the spread, large for the short put |
| A strong fall, soon | Long put | Paid | The premium |
| A moderate fall | Bear put spread | Paid | The debit |
| Holds below a level | Bear call spread, short call | Received | Capped for the spread, no limit for the short call |
| A range, with IV high | Iron condor, iron fly, short strangle, short straddle | Received | Capped with wings, no limit without |
| Settles near one level | Long call butterfly, iron fly | Paid or received | Capped |
| A big move either way | Long straddle, long strangle | Paid | The premium |
| A rise to a target, then a stall | Call ratio spread | A small credit | No limit above the upper break-even |
| Protecting a holding | Protective put, collar, covered call | Paid or received | Depends on the hedge |
Key takeaways
- Three questions pick the strategy: which direction, how big and how fast, and what implied volatility (IV) is doing. A fourth decides the size: how much you can lose.
- Credit spreads win more often and lose more when they lose. In the model, credit spreads on Nifty finish in profit about 70% of the time, debit spreads about 42%.
- A short straddle collects ₹32,993 a lot and wins 58% of the time with no limit on the loss. An iron fly on the same centre collects ₹15,865 and can lose only ₹3,635, but wins 30% of the time.
- Time and IV move strategies by very different amounts. With Nifty and IV unchanged, a short straddle earns about ₹1,411 a day and a long straddle loses the same; a bull call spread moves about ₹100.
- There is no zero loss option strategy. Hedges cap the loss, and the trades that lock in a fixed result, such as a box spread, return less than their charges.
- Costs scale with legs. One leg in and out costs about ₹90; a four-leg iron condor costs about ₹259, almost 3% of its credit.
How to choose an options strategy
Ask three questions before choosing:
- Which direction? Up, down, sideways or unsure.
- How big and how fast? A small drift, a steady trend or a sharp move. Fast, large moves suit bought options; slow or small ones suit spreads; no move suits sold premium.
- What is IV doing? High IV makes options expensive, which favours selling; low IV makes them cheap, which favours buying. Check where IV stands against its recent range with the implied volatility calculator.
Then decide how much you can lose on the trade, and pick the structure whose worst case fits. Strategies with a capped loss usually have a capped profit or a lower chance of success. For a first strategy, start with our guide to option trading for beginners.
The main strategies by market view
Bullish strategies
| Strategy | Legs | Most it can make | Most it can lose | Break-even at expiry | Best when |
|---|---|---|---|---|---|
| Long call | Buy a call | No limit | Premium paid | Strike + premium | A strong, fast rise |
| Bull call spread | Buy a call, sell a higher call | Spread width − debit | Debit | Lower strike + debit | A moderate rise to a target |
| Bull put spread strategy | Sell a put, buy a lower put | Credit | Spread width − credit | Higher strike − credit | The market holds above a level |
| Short put | Sell a put | Premium received | Large, down to zero | Strike − premium | Mildly bullish with IV high; high risk |
The bull call spread costs less than a long call and breaks even sooner, but caps the gain. The bull put spread collects a credit and wins if the market simply does not fall far.
Bearish strategies
| Strategy | Legs | Most it can make | Most it can lose | Break-even at expiry | Best when |
|---|---|---|---|---|---|
| Long put | Buy a put | Large, down to zero | Premium paid | Strike − premium | A strong, fast fall |
| Bear put spread | Buy a put, sell a lower put | Spread width − debit | Debit | Higher strike − debit | A moderate fall to a target |
| Bear call spread strategy | Sell a call, buy a higher call | Credit | Spread width − credit | Lower strike + credit | The market holds below a level |
| Short call | Sell a call | Premium received | No limit | Strike + premium | Mildly bearish with IV high; very high risk |
Neutral strategies
These profit when the market stays in a range and time decay works for them.
| Strategy | Legs | Most it can make | Most it can lose | Break-evens at expiry |
|---|---|---|---|---|
| Short straddle strategy | Sell the at-the-money call and put | Credit | No limit | Strike ± credit |
| Short strangle strategy | Sell an out-of-the-money call and put | Credit | No limit | Put strike − credit, call strike + credit |
| Iron fly strategy | A short straddle plus bought wings | Credit | Wing width − credit | Centre strike ± credit |
| Iron condor strategy | A short strangle plus further bought wings | Credit | Spread width − credit | Short put − credit, short call + credit |
| Butterfly spread strategy | Buy a lower call, sell two middle calls, buy a higher call | Middle − lower strike − debit | Debit | Lower strike + debit, higher strike − debit |
| Calendar spread strategy | Sell a near expiry, buy a later expiry at the same strike | Varies with IV | About the debit | Depends on time and IV |
Neutral selling strategies win often but can lose much more than they make in one sharp move. The hedged versions, iron flies and iron condors, cap that loss. Our guide to option selling strategies compares them on Nifty with full rules.
Volatility strategies
These profit from a large move in either direction, or from a rise in IV.
| Strategy | Legs | Most it can make | Most it can lose | Break-evens at expiry |
|---|---|---|---|---|
| Long straddle strategy | Buy the at-the-money call and put | No limit up, large down | Premium paid | Strike ± premium |
| Long strangle strategy | Buy an out-of-the-money call and put | No limit up, large down | Premium paid | Put strike − premium, call strike + premium |
Long volatility strategies lose to time decay every day the move does not come, and can lose to a fall in IV after an event even when the move does come.
Directional strategies with a hedge
- Ratio spreads buy one option and sell two or more further out. They can be entered for little or no cost and pay most at the sold strike, but the extra sold option leaves no limit on the loss beyond it.
- Synthetic futures combine a bought call and a sold put at the same strike to behave like a futures position, with the same margin and the same open-ended risk.
- Delta-neutral positions balance the legs so that small moves have little effect, leaving the position exposed mainly to time and volatility.
Strategies for a position you already hold
- Protective put: buy a put against a long stock or futures position to cap the loss.
- Covered call: sell a call against the position to earn premium, giving up the gain above the strike.
- Collar: do both, so the sold call pays for most or all of the put.
The numbers side by side
All figures below use Black–Scholes model prices with Nifty at 25,000, 12 days to the weekly expiry, IV of 14%, an interest rate of 6.5% and a lot of 65. The model chance of profit is the chance that the position is in profit at expiry, with IV unchanged and moves that follow a normal distribution.
| Strategy | Strikes | Paid or received per lot | Most it can make | Most it can lose | Break-even at expiry | Model chance of profit |
|---|---|---|---|---|---|---|
| Long call | 25,000 | ₹18,231 paid | No limit | ₹18,231 | 25,280 | 33% |
| Long put | 25,000 | ₹14,762 paid | Grows as Nifty falls | ₹14,762 | 24,773 | 36% |
| Bull call spread | 25,000 / 25,300 | ₹8,474 paid | ₹11,026 | ₹8,474 | 25,130 | 42% |
| Bear put spread | 25,000 / 24,700 | ₹7,391 paid | ₹12,109 | ₹7,391 | 24,886 | 43% |
| Bull put spread | 24,750 / 24,500 | ₹4,115 received | ₹4,115 | ₹12,135 | 24,687 | 69% |
| Bear call spread | 25,250 / 25,500 | ₹4,937 received | ₹4,937 | ₹11,313 | 25,326 | 70% |
| Short straddle | 25,000 | ₹32,993 received | ₹32,993 | No limit | 24,492 and 25,508 | 58% |
| Short strangle | 24,700 / 25,300 | ₹17,129 received | ₹17,129 | No limit | 24,436 and 25,564 | 62% |
| Iron fly | 24,700 / 25,000 / 25,300 | ₹15,865 received | ₹15,865 | ₹3,635 | 24,756 and 25,244 | 30% |
| Iron condor | 24,500 / 24,750 / 25,250 / 25,500 | ₹9,052 received | ₹9,052 | ₹7,198 | 24,611 and 25,389 | 46% |
| Long straddle | 25,000 | ₹32,993 paid | No limit | ₹32,993 | 24,492 and 25,508 | 42% |
| Long strangle | 24,700 / 25,300 | ₹17,129 paid | No limit | ₹17,129 | 24,436 and 25,564 | 38% |
| Long call butterfly | 24,700 / 25,000 / 25,300 | ₹3,594 paid | ₹15,906 | ₹3,594 | 24,755 and 25,245 | 30% |
| Call ratio spread, one bought and two sold | 25,000 / 25,300 | ₹1,284 received | ₹20,784 | No limit above | 25,620 | 84% |

Read the table in pairs. The long and short straddle are the same trade from opposite sides, and their chances add up to 100%; so do the long and short strangle. Debit and credit spreads on the same side of the market trade cost against probability. Build any row in the option profit calculator to see its full payoff.
Reading the trade-off
The chart above shows the pattern that runs through every options strategy:
- A high chance of profit comes with a large worst case. The call ratio spread finishes in profit 84% of the time in the model because it keeps its small credit whenever Nifty ends below 25,000, but above 25,620 its loss has no limit. The short strangle wins 62% of the time and has no limit either way.
- A small worst case comes with a low chance of profit. The iron fly can lose only ₹3,635, and wins 30% of the time, because Nifty must finish within about 244 points of 25,000.
- Bought strategies pay for time. Long calls, puts, straddles and strangles all win less than half the time; they make up for it with large gains on the moves that come.
- In a fair model, no strategy has an edge before costs. The prices above are model values, so each strategy's average result over all outcomes is close to zero. What differs is the shape: how often it wins and how much it loses when it does not. An edge has to come from the entry rules, the exits and the choice of when not to trade.
Win rate alone says little. If every win of the bull put spread were the full ₹4,115 and every loss the full ₹12,135, it would need to win about 75% of the time just to break even. Closing losing trades before they reach the maximum is what brings that rate down, which is why every strategy guide on this site spends more time on exits than on entries.
How time and volatility affect each strategy
Every position has three exposures: to the index moving, to time passing and to IV changing. In the model, one lot of each strategy changes in value by:
| Strategy | One day passes, Nifty and IV unchanged | IV rises one point | Nifty rises 100 points at once |
|---|---|---|---|
| Long call | −₹850 | +₹1,170 | +₹3,702 |
| Long put | −₹561 | +₹1,170 | −₹2,798 |
| Bull call spread | −₹100 | +₹68 | +₹1,204 |
| Bear put spread | −₹52 | +₹162 | −₹1,123 |
| Bull put spread | +₹117 | −₹239 | +₹768 |
| Bear call spread | +₹160 | −₹183 | −₹919 |
| Short straddle | +₹1,411 | −₹2,340 | −₹905 |
| Short strangle | +₹1,259 | −₹2,110 | −₹823 |
| Iron fly | +₹152 | −₹230 | −₹82 |
| Iron condor | +₹278 | −₹422 | −₹152 |
| Long straddle | −₹1,411 | +₹2,340 | +₹905 |
| Long strangle | −₹1,259 | +₹2,110 | +₹823 |
| Long call butterfly | +₹155 | −₹230 | −₹82 |
| Call ratio spread | +₹650 | −₹1,034 | −₹1,294 |
What the table shows:
- Wings cut every exposure together. The iron condor earns about a fifth of the short strangle's daily decay and carries about a fifth of its exposure to IV. The cost of the protection is the smaller credit.
- Spreads are slow. A bull call spread gains or loses about ₹100 a day from time and very little from IV, so its result depends almost entirely on direction.
- Straddles and strangles are mostly bets on time and volatility. A 100-point move changes a short straddle by about ₹905, less than one day of decay, but a one-point rise in IV costs it ₹2,340.
- The ratio spread is short volatility in disguise. It earns ₹650 a day and loses ₹1,294 on a quick 100-point rise, even though it is described as a bullish trade.
These figures change as expiry approaches: decay and the effect of each move grow in the final days.
The best option trading strategies for each market
No strategy is best in every market. The useful question is which one matches the current conditions, and the most valuable rule is the one that says when not to trade.
| Market | Strategy that often fits | Why | Main risk |
|---|---|---|---|
| A trend up, IV low | Long call or bull call spread | Cheap options, and the trend supplies the move | The trend stalls and time decay takes the premium |
| A trend up, IV high | Bull put spread or bull call spread | The credit spread sells expensive options; the debit spread offsets some of the IV | A sharp reversal through the short strike |
| A trend down, IV rising | Long put or bear put spread | Falls often come with rising IV, which helps bought puts | A fast rebound |
| A range, IV high | Iron condor; short strangle only with firm stops | Rich premium on both sides and decay in your favour | A breakout from the range |
| A range, IV low | Long call butterfly or calendar spread | Low cost, and the calendar gains if IV rises | Little room around the centre strike |
| A big move expected, IV low | Long straddle or long strangle | Cheap volatility before it is priced in | No move, or IV falls after the event |
| Before a scheduled event, IV high | Spreads, or no new position | Buyers overpay for IV; naked sellers face the surprise | The fall in IV after the event, or the gap |
| A quiet expiry day | Iron fly with fixed exit times | Fast decay in the final hours | Gamma: small moves change the position quickly |
Directional buying is covered in more detail in option buying strategies. The strategy guides linked in the tables above give full rule sets for each market.
Choosing between similar strategies
Long call or bull call spread?
The long call costs ₹18,231 a lot, more than twice the spread's ₹8,474, and loses about ₹850 a day to decay against the spread's ₹100. It breaks even at 25,280, 150 points above the spread. In return its gain has no limit, while the spread's stops at ₹11,026. A moderate rise to a target suits the spread; a large, fast move suits the call.
Credit spread or debit spread?
A bull put spread and a bull call spread both profit from a rise. The credit spread wins about 69% of the time in the model, profiting even if Nifty only holds steady, but risks about three times what it can make. The debit spread wins about 42% of the time and can make more than it risks. Sellers rely on exits to keep losses below the maximum; buyers rely on the move arriving before decay takes the debit.
Short straddle or short strangle?
The straddle collects ₹32,993 a lot, almost twice the strangle's ₹17,129, but profits only between 24,492 and 25,508. The strangle's range is 24,436 to 25,564, and it wins about 62% of the time against the straddle's 58%. Both have no limit on the loss and need margin of well over ₹1 lakh a lot.
Iron fly or iron condor?
The iron fly collects ₹15,865 and can lose only ₹3,635, but its profit is concentrated around one strike and it wins about 30% of the time. The iron condor collects ₹9,052, risks ₹7,198 and wins about 46% of the time across a wider range. The fly suits a view that Nifty will settle near a level, such as on expiry day; the condor suits a range.
Long straddle or long strangle?
The straddle costs ₹32,993 and needs Nifty beyond 24,492 or 25,508; the strangle costs ₹17,129 and needs it beyond 24,436 or 25,564. The straddle wins slightly more often, about 42% against 38%, and loses more when the move does not come. Both lose about ₹1,250 to ₹1,400 a day with Nifty flat.
Iron fly or long call butterfly?
On the same strikes, the two have almost the same payoff: the butterfly is paid for, with a debit of ₹3,594, and the iron fly is a credit of ₹15,865 with a maximum loss of ₹3,635. The difference is in margin and in the legs: the fly is two credit spreads, so it needs margin; the butterfly is bought, so its cost is the whole requirement.
Is there a zero loss option strategy?
No. Every options position can lose money once charges and slippage are counted. Strategies sold as zero loss usually fall into one of three groups:
- Hedged positions with a smaller loss. A collar on one lot of Nifty futures bought at 25,000, with the 24,700 put bought at ₹113.40 and the 25,300 call sold at ₹150.11, costs nothing to put on and even collects ₹36.71 a unit. Its loss is still capped at ₹17,114 a lot, not removed.
- Locked trades that return less than their costs. A box spread on the 24,700 and 25,300 strikes, buying the call spread and the put spread, costs ₹598.72 a unit in the model and pays exactly 600 points at expiry: about ₹83 a lot before charges. The four entry orders alone cost about ₹153 at ₹20 an order, and the market prices such trades too tightly to leave room.
- Adjustments that move a loss in time. Rolling a losing short option further out or into the next expiry can keep the account from showing a loss, but the risk is carried forward, often with a larger position.
The useful question is how small the worst case can be made and what that costs in premium and chance of profit. The iron fly above caps the loss at ₹3,635 a lot; a protective put caps it for a holding. Neither makes it zero.
Margin by strategy
Buyers pay the premium and no margin. Sellers post SPAN margin, which covers the exchange's estimate of a one-day loss across a range of price and volatility scenarios, plus exposure margin. Approximate figures for one Nifty lot, which vary by broker and by day:
| Strategy | Approximate margin | Why |
|---|---|---|
| Long call, put, straddle, strangle or butterfly | None beyond the premium | The loss is limited to what you pay |
| Bull put or bear call credit spread | ₹25,000 to ₹40,000 | One side only, with the loss capped by the bought strike |
| Iron fly or iron condor | ₹50,000 to ₹70,000 | The bought wings cap the loss on both sides |
| Short strangle | ₹1.4 to 1.7 lakh | No limit on the loss either side |
| Short straddle | ₹1.5 to 1.8 lakh | No limit on the loss, and the most premium at risk |
Three rules apply across strategies. Place the bought legs before the sold legs, so the hedge benefit applies at entry. On expiry day, each short index option needs an extra 2% of contract value, about ₹32,500 a lot on Nifty. And since February 2025, the margin benefit for calendar spreads is removed on the expiry day of the near contract.
Costs of multi-leg strategies
Every leg pays brokerage, securities transaction tax, exchange charges, the SEBI fee, stamp duty and GST on the way in and on the way out, plus the bid-ask spread. At ₹20 per order, with each leg bought and sold at its entry price:
| Strategy | Orders in and out | Approximate charges | As a share of the most it can make |
|---|---|---|---|
| Long call | 2 | ₹90 | 0.5% of the premium paid |
| Bull call spread | 4 | ₹161 | 1.5% |
| Bull put spread | 4 | ₹124 | 3.0% |
| Short straddle | 4 | ₹173 | 0.5% |
| Iron condor | 8 | ₹259 | 2.9% |
| Iron fly | 8 | ₹308 | 1.9% |
| Long call butterfly | 6 | ₹323 | 2.0% |
Charges are small against a position held for days and large for a strategy traded every session. Stops, adjustments and re-entries add orders. Estimate them for your broker with the brokerage calculator and include them in every backtest.
Strategies around events
Scheduled events such as RBI policy decisions, the Union Budget and election results raise IV beforehand and usually lower it afterwards. Buyers who hold through the event can lose to the fall in IV even when they are right about the direction; sellers who hold through it carry the risk of a large surprise.
Many traders either stay out of events, sell hedged structures after the announcement once IV has fallen, or use spreads that limit both the cost and the risk.
Index specifics: expiries, lots and settlement
| Index | Exchange | Lot | Expiries | Guide |
|---|---|---|---|---|
| Nifty 50 | NSE | 65 | Weekly on Tuesday, and monthly | Nifty option trading |
| Sensex | BSE | 20 | Weekly on Thursday, and monthly | Sensex option trading |
| Bank Nifty | NSE | 30 | Monthly only, on the last Tuesday | Bank Nifty |
| FinNifty | NSE | 60 | Monthly only, on the last Tuesday | FinNifty option trading |
Index options are European and cash-settled, so they cannot be exercised early. Since November 2024, each exchange offers weekly options on only one benchmark index, so weekly strategies apply to Nifty and Sensex only. Lot sizes are revised from time to time; check the exchange's current specifications before trading.
Adjusting a strategy
Adjustments change a position when the market moves against it:
- Roll a short option further away, or roll the untested side closer to collect more premium.
- Add a wing to cap the loss of a naked short position, turning a strangle into an iron condor.
- Convert one strategy into another, for example a long call into a bull call spread by selling a higher call.
- Close and re-enter around the current price.
Every adjustment pays charges and can turn a temporary loss into a permanent one. Decide the adjustment rules before the entry, and test them with the rest of the strategy.
Testing a strategy before you trade it
- See the payoff. Build the position in the options profit calculator and check the maximum loss and break-evens.
- Write the rules. Entry time, strikes, size, target, stop, time exit and the days to skip.
- Backtest. Run the rules over past expiries with charges and slippage included, using QuantPower's backtesting.
- Paper trade. Practise on live prices with paper trading and compare the fills with the backtest.
- Automate. Deploy the strategy as a bot from the strategy builder, with a daily MTM stop loss on the account.
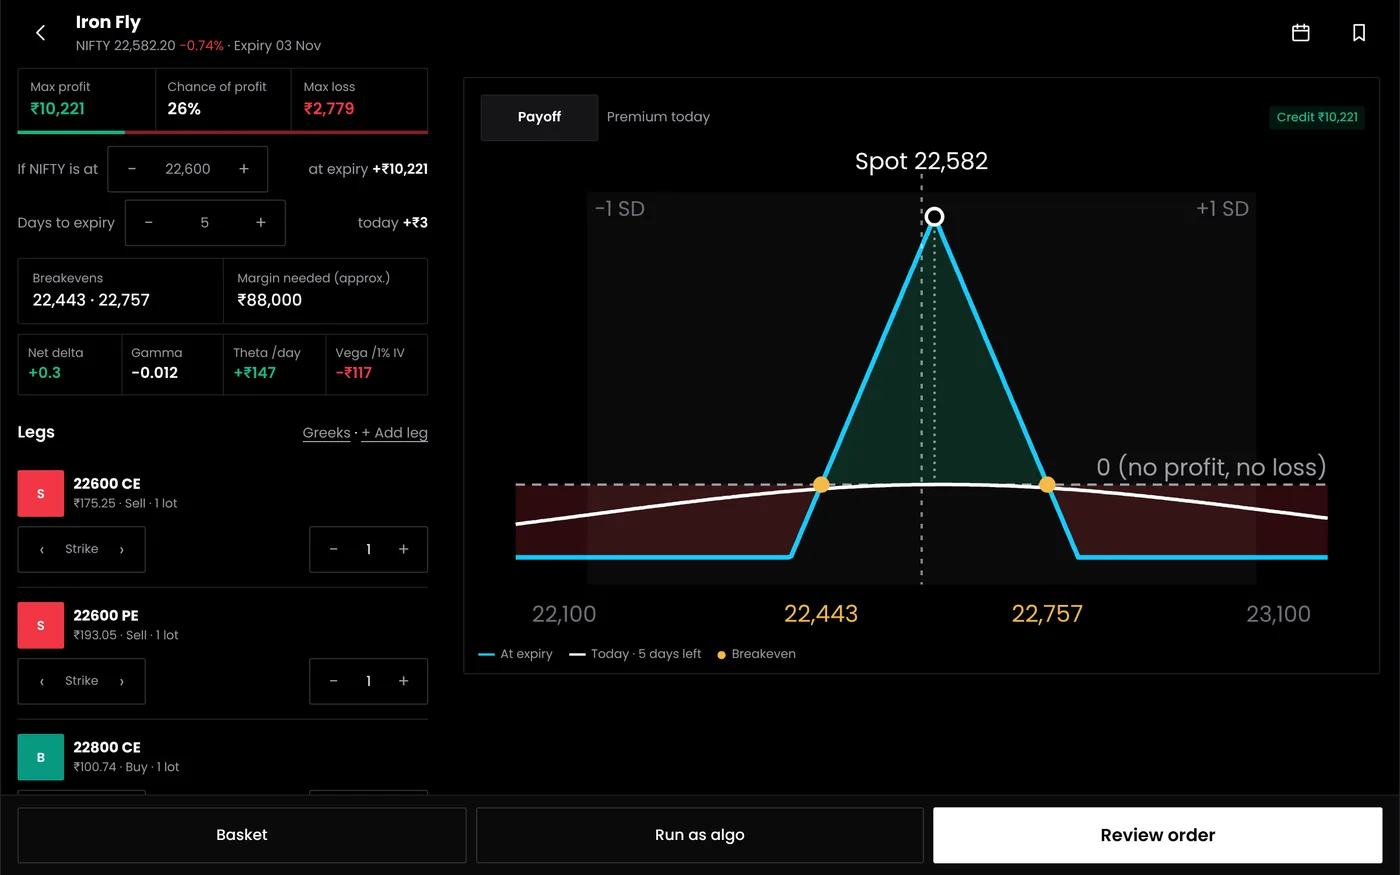
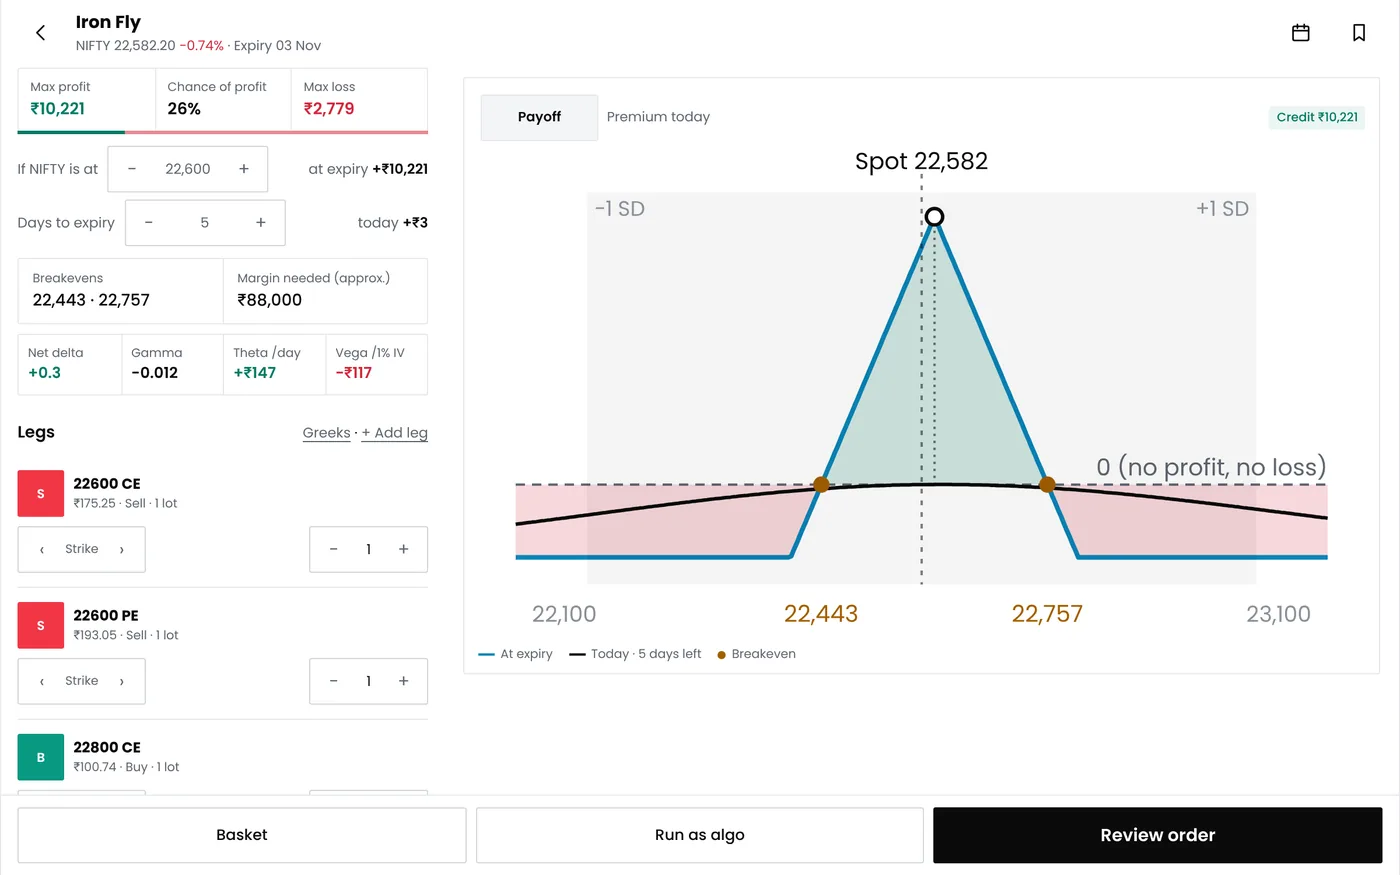
Automated strategies run on your own broker account. Under SEBI's framework for retail algorithmic trading, in full effect since 1 April 2026, every automated order carries an exchange-assigned Algo ID.
Start your free trial
Connect your broker, build a strategy and test it on paper before a single live order goes out.
Strategies by type of trader
| Trader | Strategies that often fit |
|---|---|
| Beginner | Debit spreads, then credit spreads, with a defined maximum loss |
| Intraday | Directional buying on signals; iron flies with fixed exit times on expiry day |
| Positional | Iron condors and credit spreads on weekly or monthly options; calendar spreads |
| Premium seller | Hedged selling: iron flies, iron condors and credit spreads |
| Hedger | Protective puts, covered calls and collars |
Mistakes when choosing a strategy
- Choosing by win rate alone. The call ratio spread wins 84% of the time in the model and has no limit on the loss above 25,620.
- Ignoring IV. Buying a straddle before an event at IV 18% lost ₹10,185 a lot on a quiet day in the example above.
- Using the wrong expiry. Too little time leaves no room for the view; too much means paying for decay the trade does not need.
- Using naked positions where a hedged version would do. The iron condor keeps about a fifth of the strangle's decay with a capped loss.
- Ignoring costs. On an iron condor, charges take almost 3% of the credit before any slippage.
- Not testing. Backtest the rules before trading them.
A strategy checklist
Before placing any options strategy, confirm:
- The view it expresses matches yours: direction, size, speed and volatility.
- The maximum loss fits your limit, or the stop does if the loss is not capped.
- The break-evens are realistic given the expected move.
- IV suits the strategy: high for selling, low for buying.
- The expiry gives the trade enough time without excessive decay or gamma.
- Liquidity is adequate on every leg; check the bid-ask spread on each strike.
- Exits are defined: target, stop and time.
- Costs are counted, including adjustments.
Frequently asked questions
Which options strategy is best for beginners?
Strategies with a defined maximum loss, such as debit spreads and then credit spreads, are easier to control than naked options. In the model, a bull call spread on Nifty costs ₹8,474 a lot and cannot lose more. Practise in paper trading first.
Which options strategy has the highest probability of profit?
Selling strategies win most often: in the model, credit spreads about 70% of the time and a call ratio spread 84%. Their losses can be much larger than their gains, so a high probability of profit does not mean a profitable strategy.
What is the safest options strategy?
No strategy is safe. Hedged strategies with a capped loss, such as spreads, iron condors and iron flies, limit the damage of a large move, and sizing from the maximum loss keeps that damage within plan.
Can options strategies be automated?
Yes. Entry times, strikes, stops and exits are exact rules, which suit automation within SEBI's framework for retail algo trading. In QuantPower, a strategy is backtested and paper traded before it runs as a bot on your broker account.
How many options strategies are there?
Dozens have names, but they are built from four pieces: buying or selling a call, and buying or selling a put, combined at different strikes and expiries. The fourteen in the table above cover almost every view a trader is likely to hold.
Do these strategies work on Bank Nifty, FinNifty and Sensex?
Yes. The structures are the same; the numbers change with the lot size, the index level and the expiry. Bank Nifty and FinNifty have monthly expiries only, so weekly strategies apply to Nifty and Sensex.
What is the difference between a debit and a credit strategy?
A debit strategy pays premium to open, so its maximum loss is usually the amount paid and it needs a move to profit. A credit strategy receives premium, so it profits if the market does not move far, and its loss can exceed the credit.
Related guides and terms
- Bull call spread, bear put spread, bull put spread strategy and bear call spread strategy
- Short straddle strategy, short strangle strategy, long straddle strategy and long strangle strategy
- Iron condor strategy, iron fly strategy, butterfly spread strategy and calendar spread strategy
- Ratio spread strategy, synthetic futures strategy and delta neutral strategy
- Protective put strategy, covered call strategy and collar strategy
- Option buying strategies, option selling strategies, option buying vs selling and option trading for beginners
- Options trading, option greeks and strike price selection
- Nifty option trading
Sources
- Hull, J. C. Options, Futures, and Other Derivatives. Pearson
- Natenberg, S. (2014). Option Volatility and Pricing. McGraw-Hill
- Black, F. and Scholes, M. (1973). The Pricing of Options and Corporate Liabilities. Journal of Political Economy, 81(3), 637–654
- SEBI circular SEBI/HO/MRD/TPD-1/P/CIR/2024/132: Measures to strengthen the equity index derivatives framework, 1 Oct 2024 (weekly expiries, expiry-day margin and calendar spread benefit)
- SEBI circular on safer participation of retail investors in algorithmic trading, 4 Feb 2025, and the implementation timeline to 1 April 2026
- NSE: Equity derivatives contract specifications (lot sizes, expiry days and settlement)