
What a performance review covers
- P&L over time: by day and in total, for each strategy and for all of them together.
- Drawdown: how far the strategy is below its highest point, now and at its worst.
- Win rate, average win and average loss: how often it wins, and by how much each way.
- The trade list: every trade with its entry and exit times, prices, quantity, the reason for the exit and the result.
- Charges: brokerage and statutory charges on each trade, so you judge results net of costs.
- Paper and live runs: kept apart, so you can compare paper with live.
The QuantPower Standard plan is free during the Beta (₹299/month after); Professional is ₹499/month and Ultimate ₹999/month, GST extra. See pricing. Verified P&L, in every plan, records what all your trades made, and backtesting gives the tested figures to compare with. Your broker's contract notes and P&L statement remain the official record.
Reading the numbers
No single figure tells you whether a strategy works. Read them together.
| Measure | What it tells you | Watch for |
|---|---|---|
| P&L over time | Whether results build steadily or come from a few days | A total carried by one or two large days |
| Drawdown | The deepest fall from a peak, and how long recovery took | A live drawdown beyond the backtest's worst |
| Win rate | The share of trades that made money | A high rate with average losses far larger than average wins |
| Average win and loss | The size of a typical outcome | Average losses growing over time |
| Trade list | What actually happened on each trade | Exits that do not match the rules |
| Worst day | The largest one-day loss | A worst day close to your daily loss limit |
Two figures are worth working out yourself. Expectancy, the average result per trade after costs, shows whether each trade earns anything at all. Slippage, the gap between the price the strategy expected and the fill, shows how much the market takes. Our guide to backtest performance metrics explains each measure and its formula.
Comparing live results with the backtest
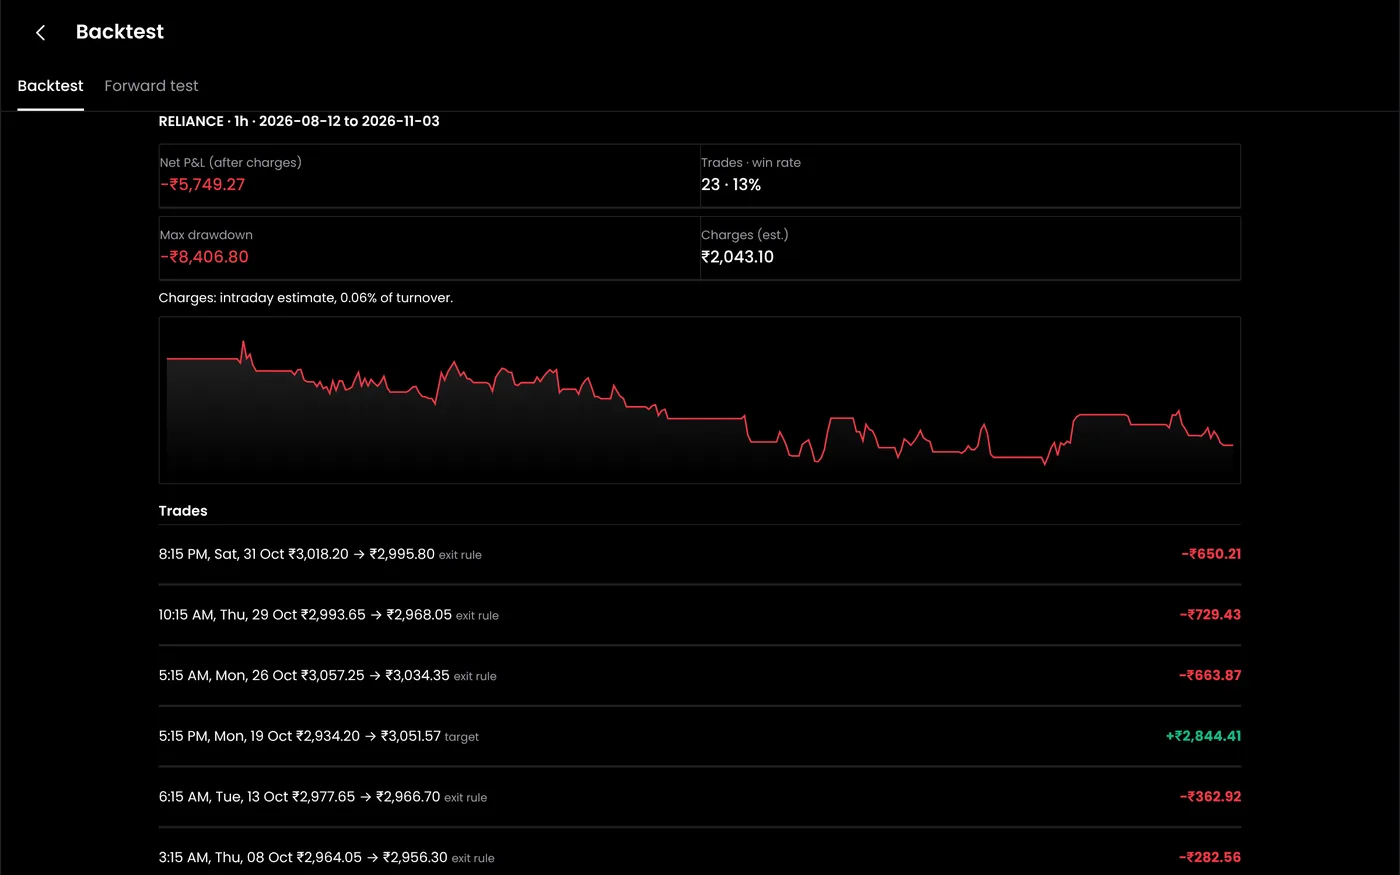
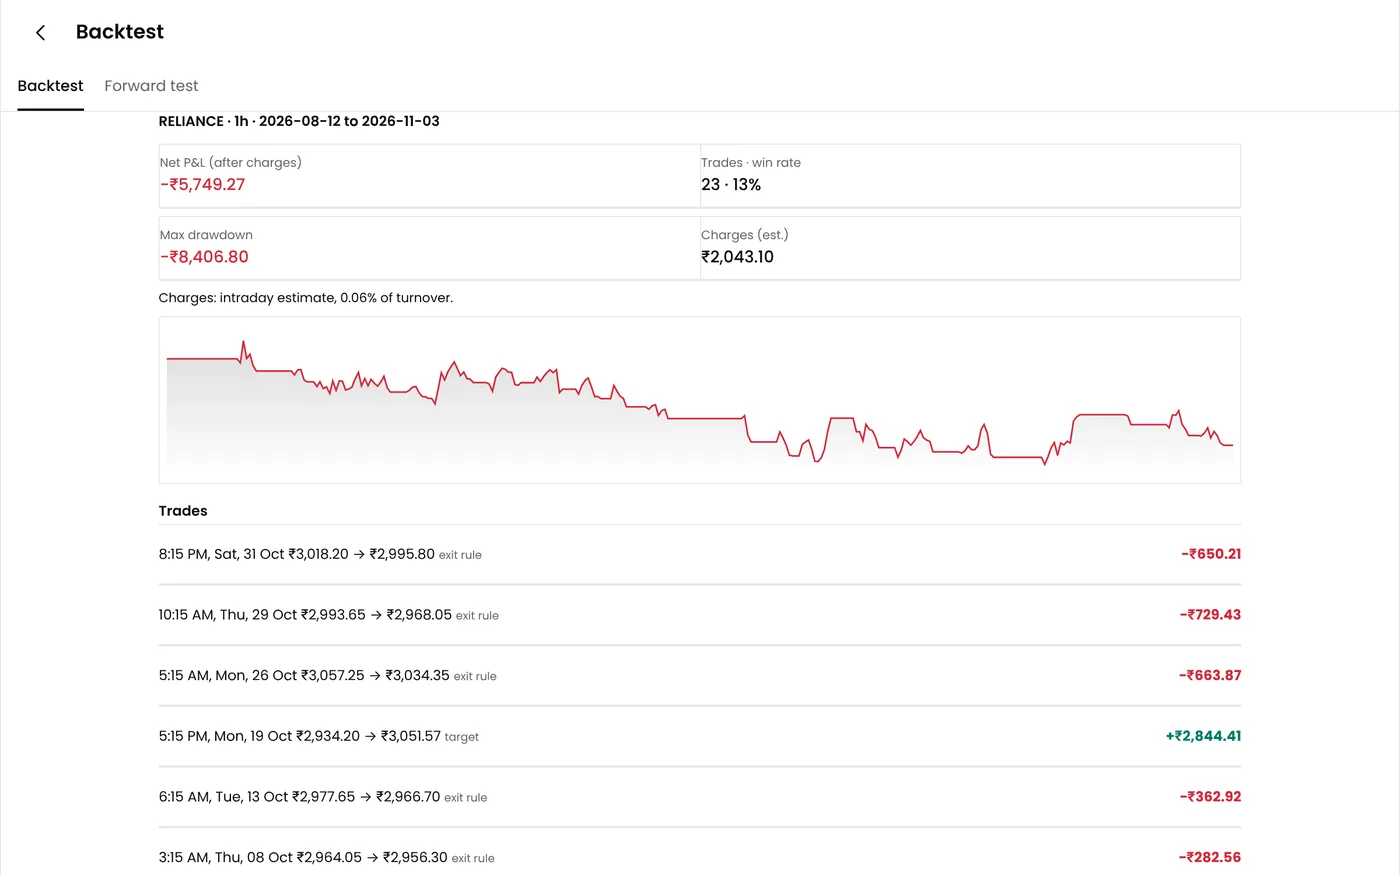
A live strategy should look like its backtest over the same kind of period, after costs. When it does not, the gap tells you where to look. The figures below are invented to show the method.
| Sample strategy | Backtest | Live, first 40 trades |
|---|---|---|
| Win rate | 58% | 55% |
| Average trade after costs | ₹420 | ₹150 |
| Slippage per trade | ₹60 assumed | ₹290 |
| Worst drawdown | ₹18,000 | ₹9,500 so far |
In this sample the win rate is close to the backtest, but the average trade has fallen by ₹270, and ₹230 of that is extra slippage. The rules are working as tested; the fills are not. The fix is the order type or the entry timing, not the strategy's logic.
When to pause a strategy
Set your pause rules before the strategy goes live, when you can think clearly about them. Typical signs that a strategy needs a pause and a review:
- Drawdown beyond plan: the live drawdown passes the backtest's worst by the margin you set in advance.
- A longer losing streak than tested: more losses in a row than the backtest ever showed.
- Slippage far above the assumption: fills keep coming in worse than the backtest allowed for.
- Trades that break the rules: wrong strikes, missed exits or duplicate orders. Pause until the cause is fixed.
- Changed market rules: a new lot size, expiry day, margin or STT rate since you tested it. Nifty's lot became 65 from January 2026, and STT on option sales rose to 0.15% of the premium from 1 April 2026.
- Events it was not tested on: budget day, an RBI policy meeting or election results.
A losing week inside the tested range is not, on its own, a reason to pause. Stopping a strategy at every dip means you keep its losses and miss the recoveries that the backtest counted on. Decide separately what to do with any positions a paused strategy still holds; the tutorial on how to pause automation covers the steps.
After a pause: four choices
- Keep it if the cause was outside the rules, such as a broker outage or an untested event, and the numbers are within range.
- Resize it if the drawdown is more than you can carry but the strategy still earns per trade. Halving the lots roughly halves the drawdown.
- Change one thing, backtest the change, and paper trade it before going live again. Several changes at once make it impossible to know which one helped.
- Retire it if the average trade after costs has stayed near zero or below over a long run of trades.
A review routine
- Weekly, briefly: P&L against plan, any trades that broke the rules, slippage and rejected orders.
- Monthly, in depth: compare with the backtest over a similar period, check drawdown against your pause rule, and decide whether to keep, resize, change or retire.
- After any intervention: note what you did and why, so the record explains the numbers later.
Plans
The Standard plan is free during the Beta; see pricing for each plan's daily allowances.
Related guides
- Backtest performance metrics: each measure and how to read it
- How to read backtest results: the backtest report, step by step
- How to pause automation: pausing one bot or all of them
- Trade journal: records that explain the numbers
- Max drawdown calculator: drawdown and the gain needed to recover from it
Start your free trial
Connect your broker, build a strategy and test it on paper before a single live order goes out.
Frequently asked questions
Should I pause a strategy after a losing week?
Not if the loss is within what the backtest and paper trading showed. Pause on the limits you set in advance, such as a drawdown or losing streak beyond the tested range, not on one bad week.
When should I retire a strategy rather than pause it?
When its average trade after costs has stayed near zero or below over a long run of trades, or the market feature it relied on has gone. A pause is for finding a fault; retiring is for a strategy with no edge left.
Should paper trading results be part of the review?
Yes. Keep paper results apart from live ones, and compare paper, live and backtest over similar periods. A strategy that holds up on paper but not live usually has a problem with fills or costs.
Should I review my strategies together as well as one by one?
Yes. Add up their daily results as well as reading each one, because the combined figure is what your account actually goes through on a bad day.
What can the report not tell me?
Why a strategy made or lost money. It shows results, not causes. Notes on events, interventions and fills explain the numbers, which is why a journal is worth keeping alongside it.
Sources
- NSE: revision in market lot of index derivative contracts from the January 2026 series (nseindia.com) (checked 20 October 2026)
- Finance Act, 2026: STT on futures and options from 1 April 2026, and NSE circular NSE/FATAX/73524, 31 March 2026 (checked 20 October 2026)
- QuantPower plans and features as listed on quantpower.tech (checked 20 October 2026)