
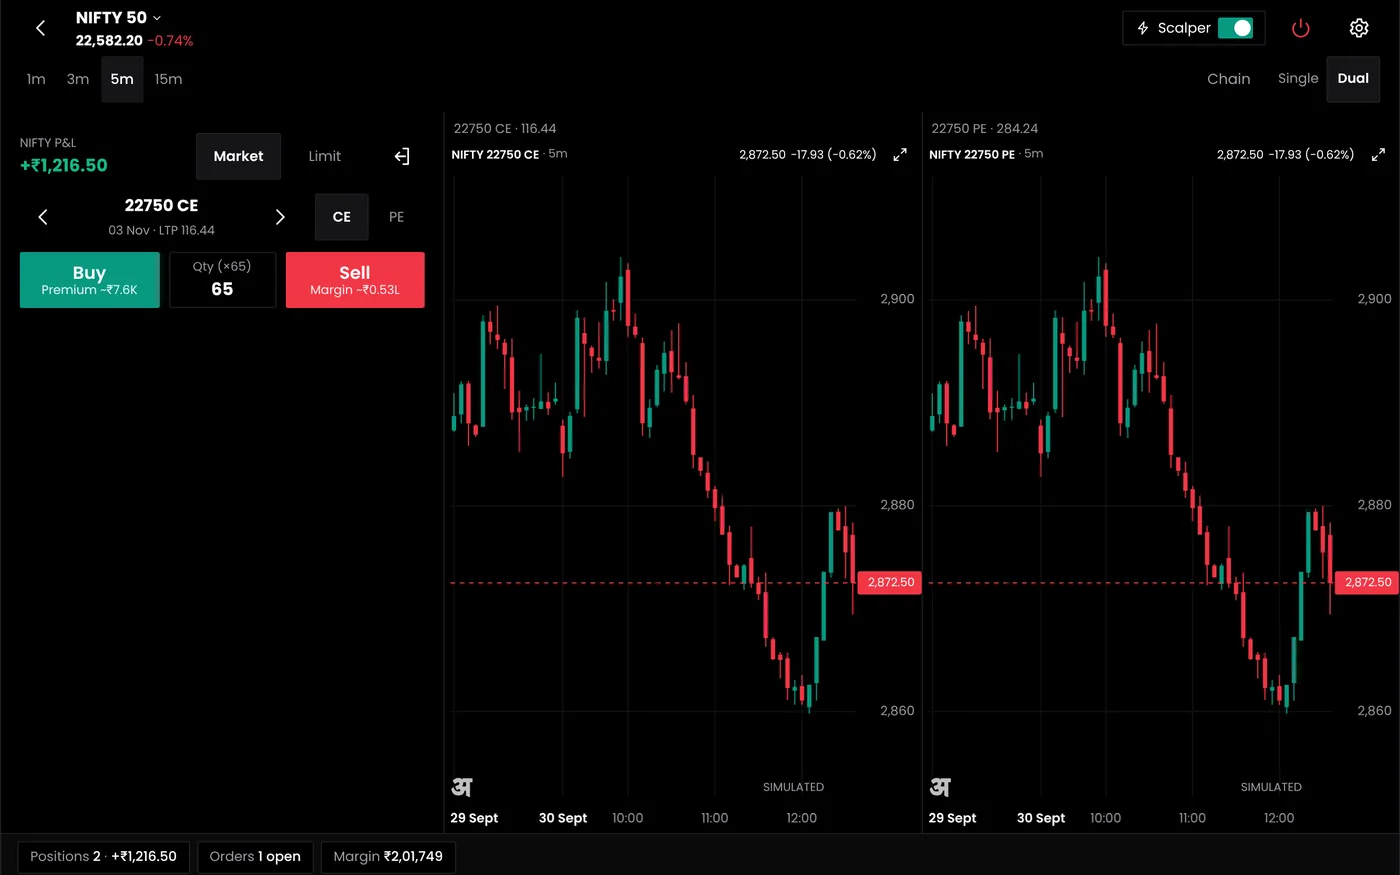
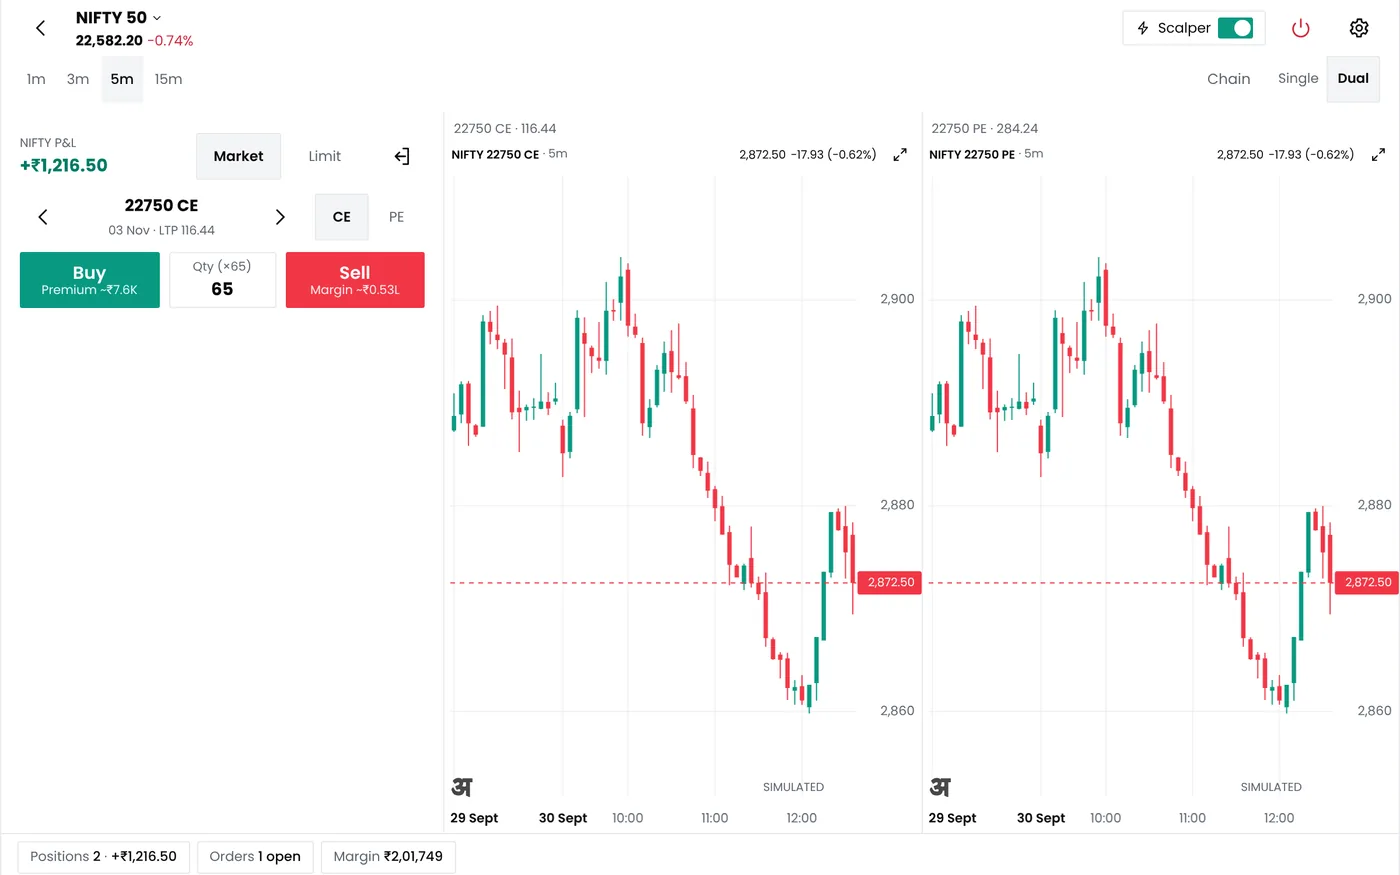
What futures analysis shows
Futures analysis brings price and positioning together for each contract:
| Field | What it tells you |
|---|---|
| Contract | The index or stock, and the expiry month |
| Price change | How far the contract has moved from the previous close |
| Open interest (OI) | How many contracts are open |
| Change in OI | Whether traders added positions or closed them |
| Buildup | The label that price and OI give together |
It covers index futures, such as Nifty and Bank Nifty, and stock futures, so you can read both the market as a whole and single companies.
How each contract is labelled
Futures analysis compares the direction of the price with the direction of open interest over the same period, and gives each contract one of four labels:
| Price | Open interest | Label | Usual reading | What to check next |
|---|---|---|---|---|
| Up | Up | Long buildup | New buyers opened positions | Whether volume is above normal and the move clears resistance |
| Down | Up | Short buildup | New sellers opened positions | Whether the fall breaks support or stalls |
| Up | Down | Short covering | Short sellers bought back | Whether fresh positions follow once the covering ends |
| Down | Down | Long unwinding | Holders sold out | Whether selling dries up near support or turns into short buildup |
These labels are readings, not facts. Every contract has a buyer and a seller, so "long buildup" means the buyers were the more aggressive side, judged from the price. Our guide to OI buildup analysis explains each reading with examples and sets out its limits.
Index futures and stock futures
The same four labels apply to both kinds of contract, but they behave differently:
| Index futures | Stock futures | |
|---|---|---|
| Settlement at expiry | Cash | Delivery of shares |
| What a buildup reflects | Positioning in the whole market, mixed with hedging and arbitrage | Positioning in one company, often around results or news |
| F&O ban | Does not apply | Applies when open interest nears the market-wide position limit |
| Typical use of the reading | Context for index options and futures trades | Shortlisting stocks to study further |
Index futures carry large hedging and arbitrage positions, so a change in their open interest does not always reflect a view on direction. Stock futures settle by delivery, which is why most traders close or roll them before expiry. A sharp fall in a stock's open interest in the last days of the month is often traders leaving the contract, not a change of view.
Reading buildup through the expiry cycle
Nifty futures expire on the last Tuesday of the month. In the final week, traders roll positions from the expiring contract to the next month, so open interest falls in the old contract and rises in the new one. That can look like long unwinding in one and a buildup in the other. Before reading a label near expiry:
- Add the months together. Combined open interest across the current and next month shows whether positions were really closed.
- Check the next month's contract. Rising open interest there, with little change in price, is usually rollover.
- Expect a reset after expiry. The new current month starts with the positions rolled into it, so its first readings carry the old month's history.
When open interest updates
Prices change with every trade, but exchanges publish open interest at intervals during the session. A label early in the day can change by the close, so treat intraday readings as provisional and the day's final figures as the record.
Compare like with like. A 3% rise in open interest means little in a contract whose open interest often moves 5% a day, and a lot in one that rarely moves 1%.
How traders use futures analysis
- Context for an options trade. Before selling a call spread on Nifty, check whether futures positioning agrees with the view behind the trade or argues against it.
- Shortlisting stocks. Look down the stock futures for the largest changes in open interest, then study the chart and the news before deciding anything.
- Judging a rally or a fall. A rally on short covering often fades once the covering ends; one on long buildup has new buyers behind it.
- Reviewing positions. Long unwinding in a stock you hold long is a reason to review your stop, not a signal on its own.
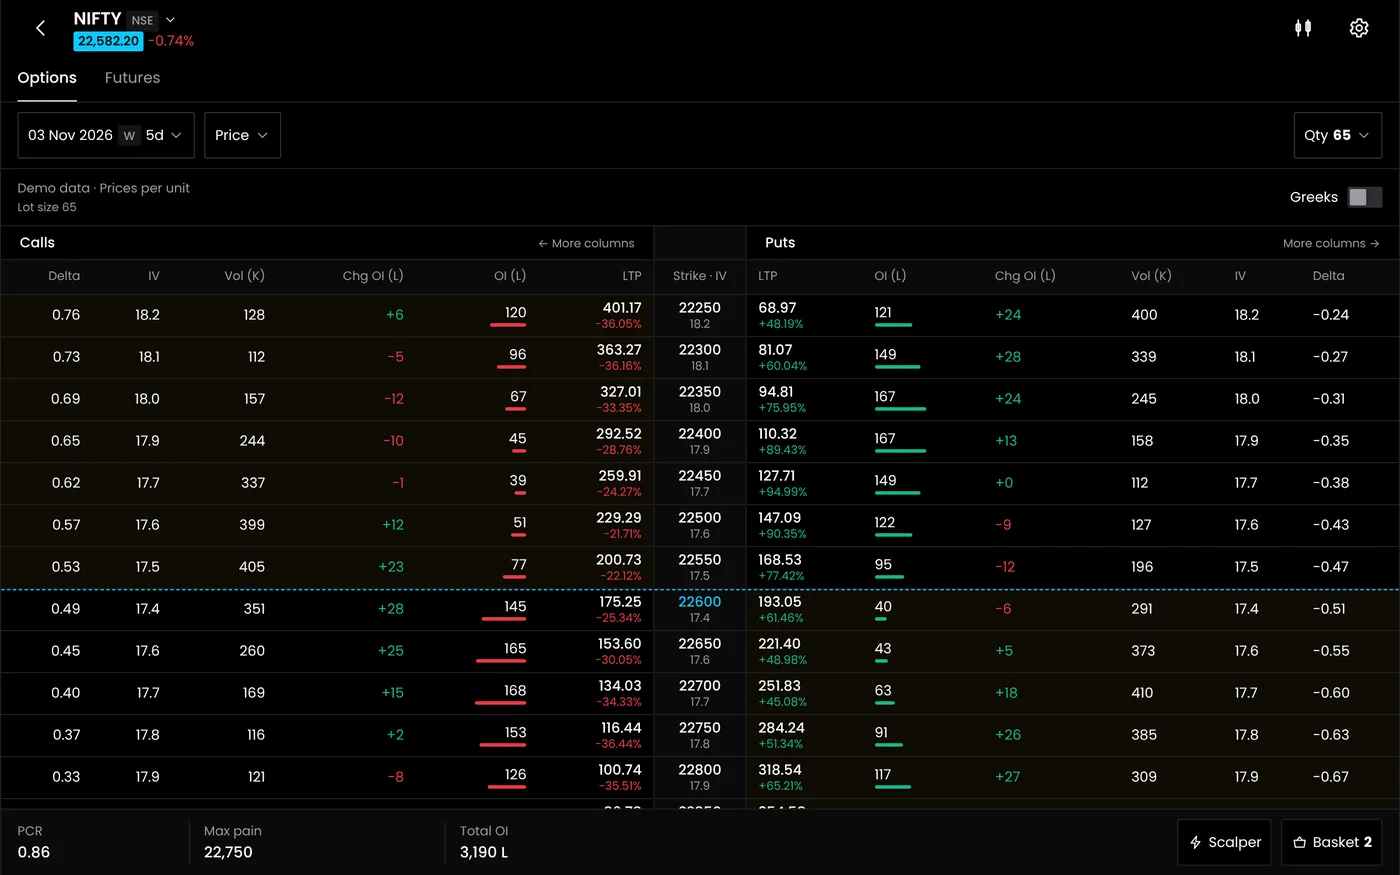
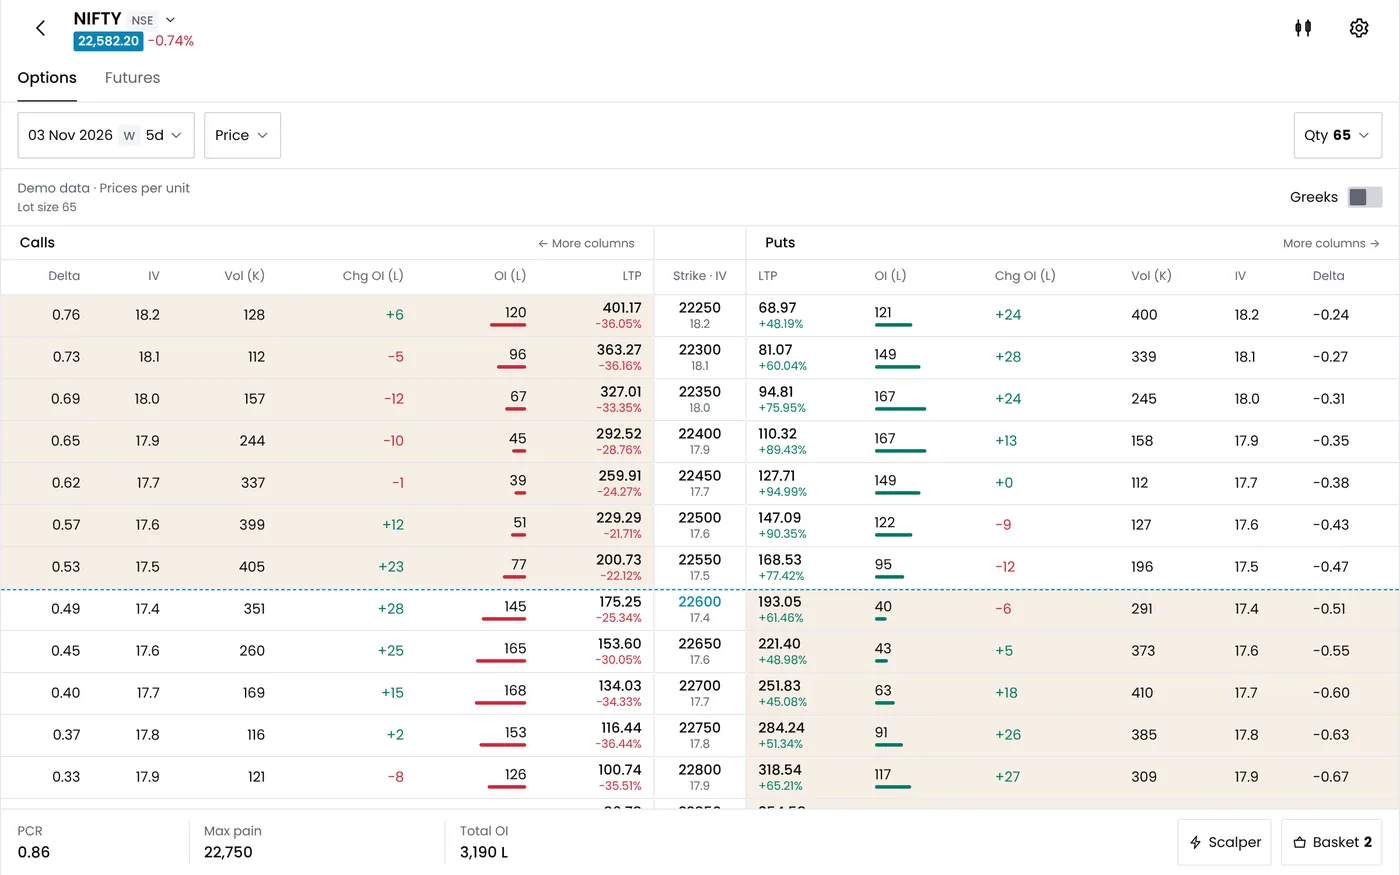
- Pairing with the option chain. Futures show overall positioning, while open interest by strike shows where option writers expect the index to stay. QuantPower's option trading app shows OI and change in OI for every strike.
Limits to keep in mind
- It looks backward. Buildup describes what traders did, not what the price will do next.
- Hedging and arbitrage add open interest without a view on direction, especially in index futures.
- Volume matters. A buildup on thin volume carries less weight than one on heavy volume.
- News can reverse it. Results, policy decisions and global moves can undo a buildup within a session.
Futures analysis shows data. QuantPower is trading software, not an adviser, and gives no buy or sell calls; the decision and its risk stay with you.
Plans
The QuantPower Standard plan is free during the Beta (₹299/month after); Professional is ₹499/month and Ultimate ₹999/month, GST extra. See pricing. Every plan starts with a free trial.
Related guides
- OI buildup analysis: the four readings with examples and their limits
- Futures basics: lots, margin, expiry and rollover
- Option trading app: the option chain with live Greeks, IV and open interest
- Nifty PCR: reading put and call open interest together
- Live trading terminal: charts, orders and positions on one screen
Start your free trial
Connect your broker, build a strategy and test it on paper before a single live order goes out.
Frequently asked questions
Is futures analysis included in the Standard plan?
Yes. The Standard plan is free during the Beta; see pricing for each plan's daily allowances.
Which futures does futures analysis cover?
Index futures, such as Nifty and Bank Nifty, and stock futures.
Why does open interest fall in the expiry week?
Traders roll positions from the expiring contract to the next month. Add the open interest of both months before reading the fall as long unwinding.
Does futures analysis tell me what to buy or sell?
No. It shows how price and open interest have changed. QuantPower gives no tips or calls, and the trading decision is yours.
How is the buildup label decided?
From the direction of the price change and the change in open interest over the same period. Both up is long buildup, price down with OI up is short buildup, price up with OI down is short covering, and both down is long unwinding.
Can a contract show long buildup and still fall the next day?
Yes. Buildup describes positions already taken, and new information can reverse the move. Use it with price levels and your own stop.
Sources
- NSE: open interest data, equity derivatives contract specifications and expiry days (nseindia.com) (checked 20 October 2026)
- SEBI: circular on the market-wide position limit and future-equivalent open interest, 29 May 2025
- QuantPower plans and features as listed on quantpower.tech (checked 20 October 2026)