
Before you start
- A connected broker for live prices.
- A large screen. Four or six charts need a laptop or desktop to be readable.
- A purpose for each chart. For example: the index, its futures, a heavyweight stock and a higher timeframe of the index.
Step 1: Choose a layout
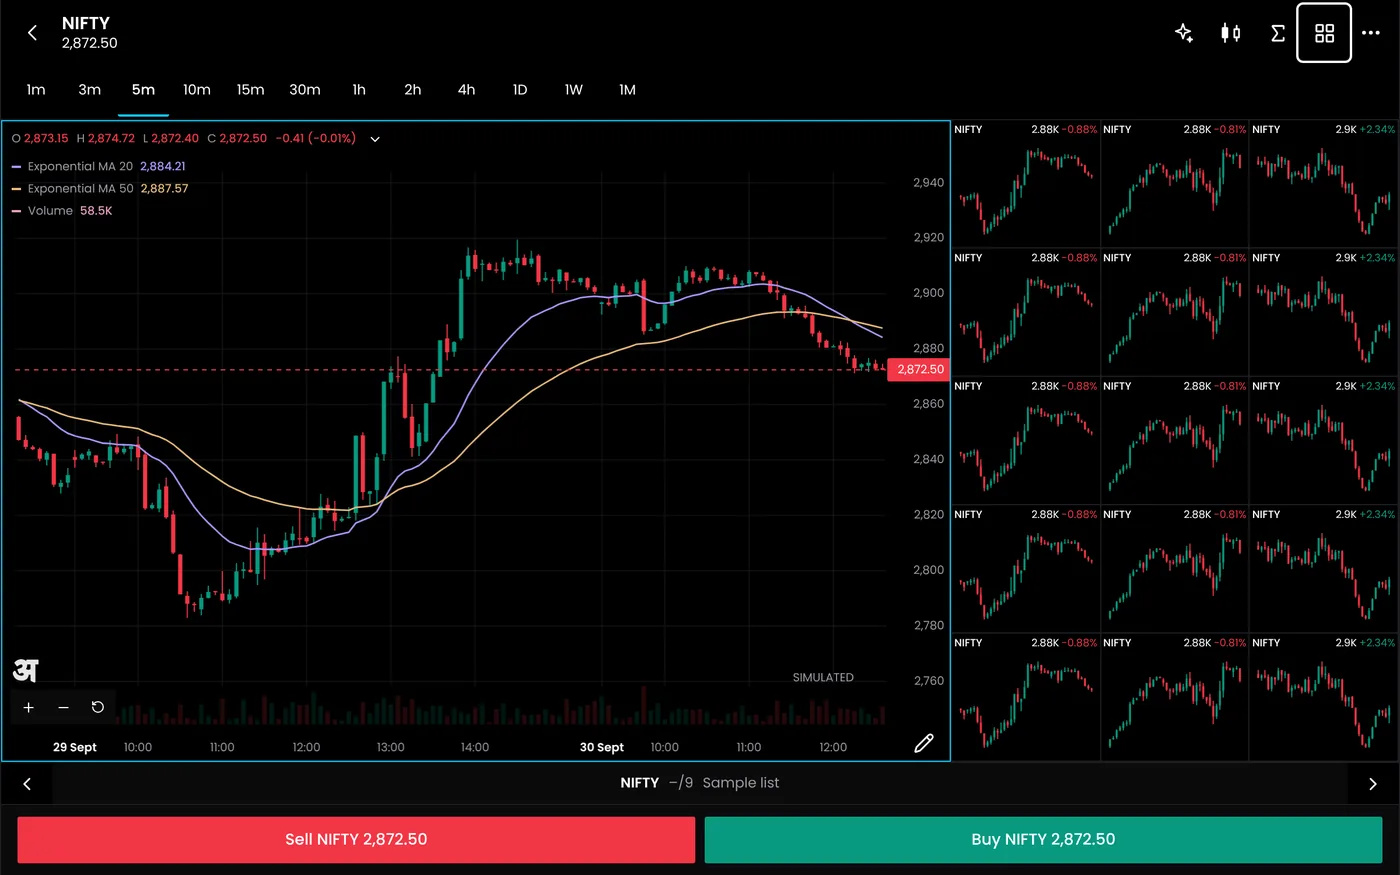
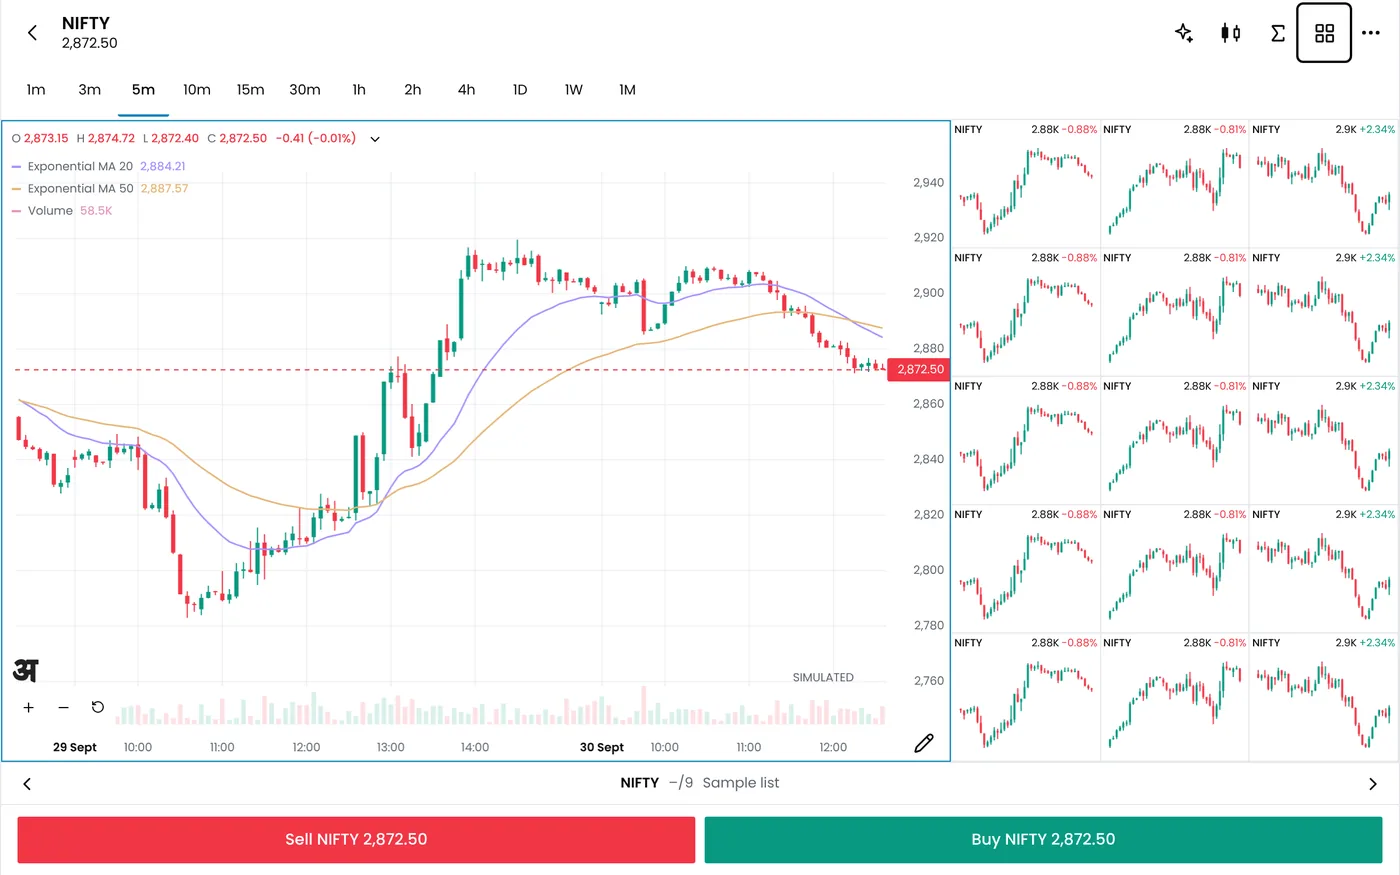
Open Terminal and choose a layout, such as two or four charts side by side. Four is a good starting point: enough to compare, still large enough to read.
Step 2: Set each chart
For each chart, choose:
- The instrument: an index, a future, a stock or an option.
- The timeframe: such as 5 minutes, 15 minutes, 1 hour or 1 day.
- The indicators: such as moving averages, VWAP, RSI or Supertrend.
Charts are Arth.live charts, with 100+ indicators, drawing tools including the Fibonacci family, and bar replay.
Step 3: Use layouts that answer a question
| Layout | Charts | Question it answers |
|---|---|---|
| Index and futures | Nifty 50, Nifty futures | Is the futures premium widening or narrowing? |
| Two timeframes | Nifty on 1 day and 15 minutes | Does the intraday move agree with the daily trend? |
| Index and heavyweights | Nifty, HDFC Bank, Reliance, ICICI Bank | Which stocks are driving the index? |
| Option and underlying | Nifty, the 25,000 call, the 25,000 put | How are premiums reacting to the move? |
Our multi-timeframe strategy guide explains how to combine timeframes in rules.
Step 4: Mark your levels
Before the open, draw the levels from your plan on the daily and hourly charts: the previous day's high and low, pivot levels and large open interest strikes. The pivot point calculator gives standard levels.
Step 5: Save the layout
Select Save layout and give it a name, such as "Morning: index and futures". The same screen is ready at the next session.
Step 6: Trade alongside the charts
Place orders from the order panel in the live trading terminal while you watch the charts, and set market alerts at the levels you marked.
Common problems
| Problem | What to do |
|---|---|
| Charts are slow | Fewer charts or fewer indicators per chart reduce the load |
| One chart does not update | Check the instrument has not expired, then reload the chart |
| Indicators differ from another platform | Check the settings, such as the period and whether the source is the close |
Next steps
- Create a market alert
- Use the option chain
- Read more about multiple charts
Frequently asked questions
How many charts can I view at once?
Several, arranged in a grid on one screen.
Can each chart use a different timeframe?
Yes.
Can I trade from the charts?
Use the order panel in the live trading terminal while you watch your charts.