Every one of these actions opens the app's own sheet, which shows the order exactly as it will be sent, and nothing reaches your broker until you confirm it there. The chart only draws and starts; the order path sends. This is enforced in the app's code: a check that runs when the app is built fails if any chart code tries to send an order itself. The same lines appear on the option charts of the option Scalper, so a fast trade there can be managed in the same way.
What trading from the chart does
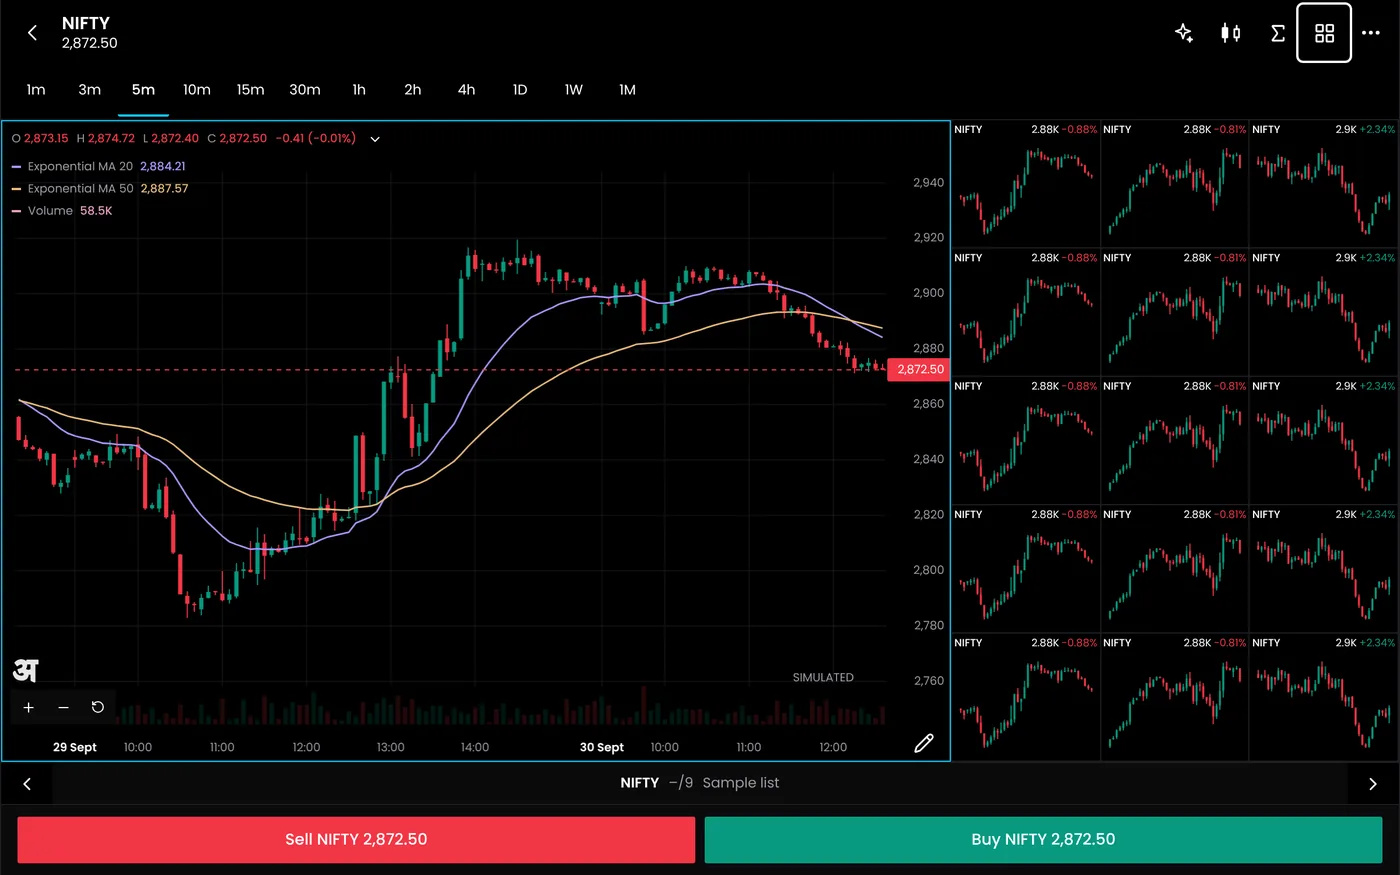
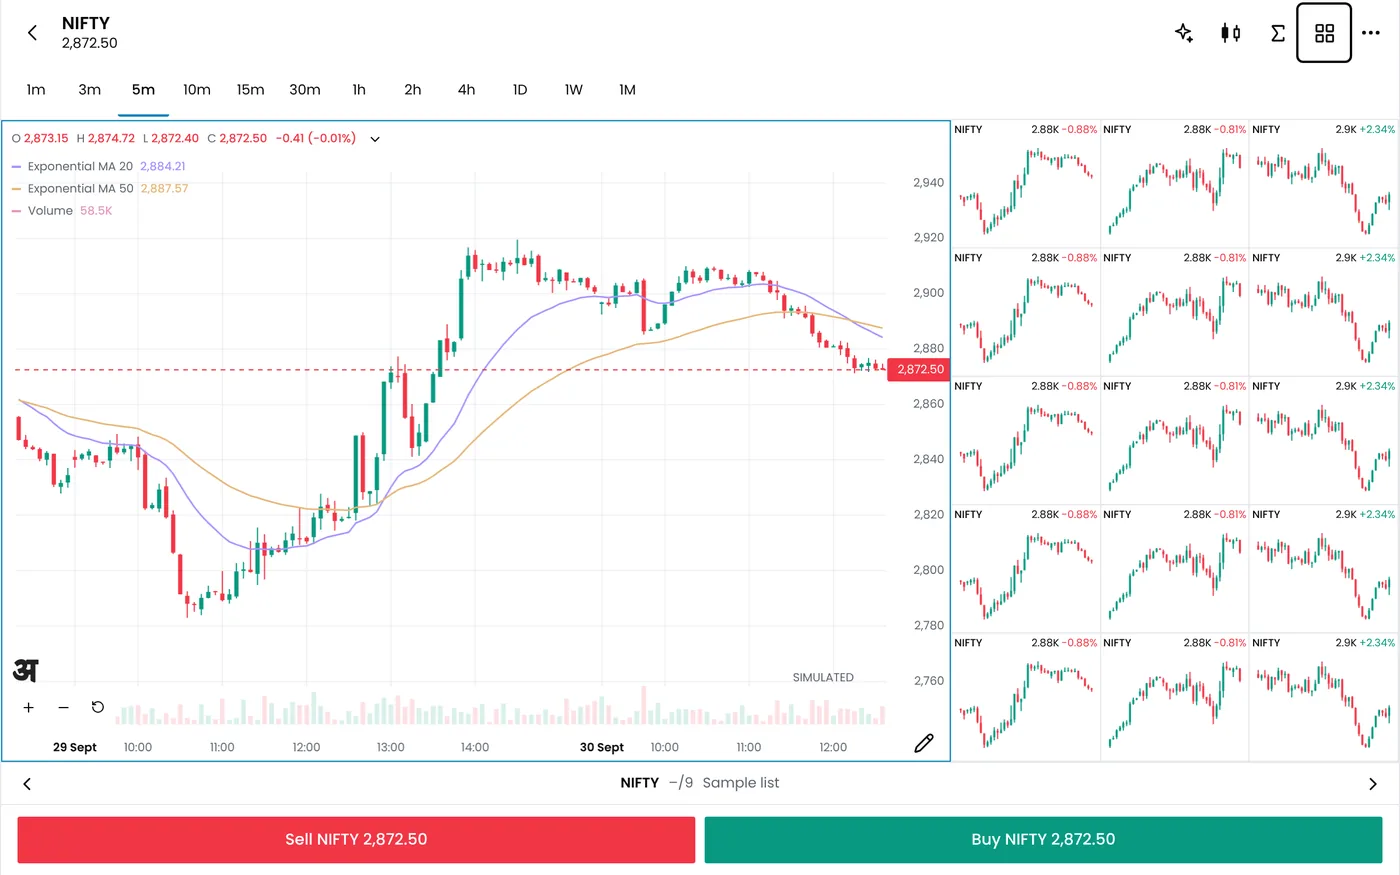
| Part | What it does |
|---|---|
| Buy and Sell | Under every chart; they open the order sheet with the side and the last price filled in |
| "+" at a price | Puts a new-order line on the chart beside the last price; drag it to your price, then tap Buy or Sell on it |
| Position lines | Your open position at its average price, with the quantity and live profit or loss, and an Exit button |
| Order lines | Each working limit or stop order at its price or trigger, with a Cancel button |
| GTT lines | Each waiting GTT leg at its trigger, with a Delete button; an OCO shows both legs |
| Dragging | Limit, stop-loss and stop-loss market orders, and GTT triggers, can be dragged to a new price |
| Price step | A dragged price lands on the instrument's tick size from the day's instrument list |
| Lines per chart | Up to 12, positions first; lines outside the visible prices are counted at the top or bottom edge |
| Forward test | Forward test positions and orders show on the chart too, each labelled "Forward test" |
| Confirming | Every action opens a sheet: the order sheet, Modify, Cancel, Exit, or "Change this GTT?" |
| Where | The Chart screen on a phone or laptop, the trading terminal, and the Scalper's option charts |
| Price | Free: charts and manual orders use no tokens |
A short history of trading from the chart
For most of the history of markets, the chart and the order were in different places. A trader read a chart printed on paper or drawn by hand, then phoned a broker or walked to a trading post to place the order. Even when charts moved onto computer screens in the 1980s and 1990s, the order entry window was usually a separate program, and the price on the chart had to be typed into a ticket by hand.
Electronic futures trading brought the two closer. The price ladder, a vertical list of prices on which a single click placed an order at that price, put the order on the same axis as the price. Trading Technologies patented its version, MD Trader, in the United States in 2004; the patents described a column of prices that stays still while the quantities beside it change, so that a click lands on the price the trader meant.1 Retail trading platforms of the mid-2000s brought similar ideas to the chart itself: a pending order or a stop-loss drawn as a horizontal line across the candles, which the trader could drag to change it.
India's retail market moved online in the 2000s and onto phones in the 2010s. The number of demat accounts passed 10 crore in 2022 and kept rising, and much of the new trading happened on phones.2 On a small screen, an order ticket with eight fields is slow, and a line on the chart is easy to read. At the same time, a line that sends an order the moment it is dropped is easy to drop by mistake. QuantPower's chart trading keeps the line for reading and starting an action, and keeps the confirmation on a sheet that states the order in full.
The standing order also changed. Brokers in India now offer GTT (good till triggered) orders, which wait at a trigger price for days or months and place an order only when the price reaches it. A GTT is the natural thing to draw on a chart, because it is a price level by definition, and QuantPower draws each GTT leg at its trigger.
Where you can trade from a chart
| Screen | What you get |
|---|---|
| Chart screen on a phone | One chart or a grid of several, with Sell and Buy under the chart; turned sideways, the chart takes the whole screen and Sell and Buy become two buttons on it |
| Chart screen on a laptop | The same chart workspace in the browser, with the watchlist beside it |
| Trading terminal | The chart beside the watchlist, the order sheet and your positions, orders, holdings and algos |
| Scalper | The option charts of the chosen strike, with your order and position lines on the call and the put |
The lines and the "+" belong to each chart, not to one screen. In a grid of several charts, each chart draws the lines for its own instrument; the tags, their buttons and the "+" appear when you open one chart on its own with its expand button. The Sell and Buy buttons act on the active chart, the one with the highlighted frame, and with two or more charts on screen they name its symbol, for example "Buy HDFCBANK", so you know which instrument the order is for.
Index charts, such as the Nifty 50 itself, have no orders of their own, because an index is not traded directly. To trade the index, use its futures or options: open the future's or option's chart, or use the Scalper for index options.
Buy and Sell under the chart
The Sell and Buy buttons under the chart show the last price, for example "Buy 25,243.40". A tap opens the order sheet with:
- the side you tapped;
- the chart's instrument;
- the last price, as a starting point for a limit price.
The order sheet is the same one used everywhere in QuantPower. It has tabs for Regular, Bracket, Cover, GTT and, for shares, SIP orders; order types Market, Limit, SL and SL-M; Intraday, Delivery, Overnight and MTF products where they apply; Day or IOC validity; iceberg slicing; and optional stop-loss and target prices, which QuantPower arms as a GTT once the entry fills. Bracket and cover orders, after-market orders and MTF are offered where your broker supports them. The margin, the funds available and the charges come from a preview on QuantPower's server before you confirm.
The buttons are switched off when the chart cannot be trusted for a trade: while the feed is reconnecting, stale or down, the buttons say why and stay off. When no broker is connected, they take you to the screen to connect one.
An order at a price you choose: the "+"
The "+" sits beside the last price on the price scale. It lets you choose a price on the chart rather than type it:
- Tap "+". An amber line appears at the last price, with a tag that says "↕ Limit" and the price, and three buttons: Buy, Sell and ✕.
- Drag the tag up or down to the price you want. A label follows your finger with the price, rounded to the instrument's tick size.
- Lift your finger. The line stays at that price.
- Tap Buy or Sell on the tag. The order sheet opens as a Limit order at that price.
- Check the order in the sheet: quantity, product, validity and anything else you need.
- Confirm in the sheet.
Tap ✕ to remove the line without placing anything. The amber colour marks a line that is not an order yet, so it is never confused with a working buy or sell order. Changing the chart to another instrument removes it.
The "+" is shown when the chart is in its normal pointer mode, not while a drawing tool is selected, and not during replay. It also needs live, tradable prices for the chart's instrument and the last price inside the visible price range.
The lines on the chart
Each line tells you what it is by its colour and the words on its tag:
| Line | Colour | Tag words | Button |
|---|---|---|---|
| Open position | Blue, for long and short alike | "LONG 130" or "SHORT 65", with live profit or loss | Exit |
| Buy order | The chart's up colour | "BUY 130 · LIMIT", "BUY 65 · SL trigger" | Cancel |
| Sell order | The chart's down colour | "SELL 65 · LIMIT", "SELL 65 · SL-M trigger" | Cancel |
| GTT leg | Buy or sell colour | "GTT SELL 50 · at or below" | Delete |
| New order being placed | Amber | "↕ Limit" and the price | Buy, Sell, ✕ |
A position's line is blue whether you are long or short, so it is never mistaken for a buy or a sell order. A line with "↕" before its words can be dragged.
The tag can carry a short note: "part filled" for an order that has filled in part, "OCO" for one leg of a one-cancels-other GTT, and "Forward test" for a position or order on the Forward test account. A position's profit or loss is worked out live from the price for shares and F&O on NSE and BSE, and taken from the server's figure for other segments.
At most 12 lines are drawn on one chart, with positions first, because more than that cannot be read on a phone. The rest stay on the Orders and Positions screens. When a line's price is outside the visible part of the chart, a note at the top or bottom edge counts it, for example "▲ 1 order above". Tags close to each other are moved apart so that two never overlap. In a grid of two or more charts, and in the Scalper's Dual view, the lines are drawn without tags; open the chart on its own to use them.
The lines follow your account. When an order is placed, filled, changed or cancelled, when a basket runs, when a risk control acts or when a GTT changes, QuantPower reads your orders, positions and GTTs again, and the lines move to match within a moment. Lines appear only with live data from your account; a chart without a connected broker shows none.
Changing an order by dragging its line
A working order can be moved to a new price by dragging its tag:
- Press and hold the tag of the order, then move it up or down. A small movement is needed before it counts as a drag, so a tap is never taken for a drag.
- Watch the tag while you drag. It shows the order and the new price, for example "BUY 130 · LIMIT → 141.50", and the price is rounded to the tick size.
- Lift your finger. The order sheet opens in Modify, with the new price filled in.
- Check and confirm the change in the sheet.
What moves depends on the order type:
| Order | What the drag changes |
|---|---|
| Limit | The limit price |
| Stop-loss market (SL-M) | The trigger price |
| Stop-loss limit (SL), not yet triggered | The trigger, with the limit moved by the same amount so the gap between them stays the same |
| Stop-loss limit (SL), already triggered | The limit price it now rests at |
Orders that can be dragged are open, partly filled, trigger-pending or after-market limit and stop orders that your broker lets QuantPower change. A bracket or cover order, a leg of an iceberg order, and an order your broker marks as not modifiable cannot be dragged; their lines have no "↕". A market order has no price of its own, so it has no line.
Moving a GTT trigger
A GTT leg's line can be dragged too. When you lift your finger, a sheet titled "Change this GTT?" opens with the old trigger and the new one side by side, for example "Trigger 790.00 → 795.00". If the leg has a limit price, the limit moves by the same amount, keeping the gap; if it is a market leg, the sheet says "Order: Market, as before". For an OCO, the sheet also says where the other leg stays. Nothing changes until you tap Change GTT; Keep it as it was leaves it alone.
If the price has already reached the new trigger, the GTT would fire at once. The sheet then says "This GTT was not moved", explains why, and offers only Close. QuantPower's server refuses such a change too.
Cancelling an order or deleting a GTT
- An order's Cancel button opens the "Cancel this order?" sheet, with the side, the instrument and the order's details. Cancel order sends the cancel; Keep it closes the sheet.
- A GTT line's Delete button opens the "Delete this GTT?" sheet for that GTT.
- Tapping an order's words opens the order's details, the same view as on the Orders screen.
A cancel goes to the broker the order went to, through the same order path as every other action.
Exiting a position from its line
The position's Exit button opens the order sheet with an exit already filled in: a Market order on the opposite side, for the whole quantity, with the position's product and on the broker that holds it. Check it and confirm. To exit only part of the position, change the quantity in the sheet before you confirm.
Tapping the position's words, rather than Exit, opens the position's own sheet, where you can see its details and choose what to do.
When you hold the same instrument under two products, or at two brokers, each holding gets its own line, and the tag says which product or broker it is, so you exit the one you mean.
Forward test lines
The Forward test account is QuantPower's test account: its orders stay inside QuantPower and never reach a broker. Forward test positions and orders appear on the chart with "Forward test" on their tags, beside your real ones. The label is placed first on the tag, so that on a narrow tag it is never the word that gets cut off. Real and Forward test lines are read separately and are never added together.
When the lines and the "+" are not shown
| Situation | What you see |
|---|---|
| No broker connected, or signed out | No lines; Buy and Sell lead to connecting a broker or logging in |
| The chart shows an index | No lines and no "+"; trade its futures or options |
| Prices paused: the feed is stale, reconnecting or down | Buy and Sell are off and say why; no "+" |
| Chart replay, which plays past candles back | No lines and no "+" |
| A drawing tool is selected | Lines stay, but tags cannot be dragged and there is no "+"; switch back to the pointer |
| A chart in a grid of two or more | Lines without tags and no "+"; open the chart on its own with its expand button |
| More than 12 lines | The first 12, positions first; the rest on Orders and Positions |
How each action is confirmed
The confirmation is the same as for any order in QuantPower:
- The sheet states the order in full before you act.
- You confirm with the sheet's button. On a phone, the order sheet's confirm is a swipe across the button by default, so a stray touch does not send an order; on a laptop it is a button.
- Your confirmation is recorded first on QuantPower's server, tied to your login session and to the exact order shown, valid once and for 60 seconds.
- The order is sent with a key that stops a repeated request from placing it twice.
- The checks run: the kill switch, the daily loss limit, the cap on orders a day, the ban list, the broker login and the static IP.
If the answer is lost on the way back, the app asks the server whether the order exists before it says anything, and it never sends the order again on its own. A kill switch that is on refuses new positions in its segments until the segment's next session, while orders that close a position still go through, so an Exit from a line works even then.
Placing a limit order from the chart, step by step
- Open the chart of the instrument, for example a share or a futures contract.
- Check that the chart shows live prices, not a paused feed.
- Tap "+" beside the last price.
- Drag the amber line to your price.
- Tap Buy or Sell on its tag.
- In the order sheet, set the quantity, the product and the validity. Add a stop-loss and a target if you want them armed once the order fills.
- Check the margin and charges shown.
- Confirm.
The new order's line appears on the chart at its price. If it fills, the order line goes and a position line appears at the fill price.
Trailing a stop by hand from the chart
Suppose you hold a position and protect it with a stop-loss order or a GTT. As the price moves in your favour, you can move the stop after it:
- Find the stop's line under the price for a long position, or above it for a short one.
- Drag it towards the price, to the new level.
- Confirm the change in the Modify sheet, or in "Change this GTT?" for a GTT.
- Repeat as the price moves.
Moving a stop by hand keeps every change in your own hands. For a stop that trails on its own, set a trailing step in an algo, in a bracket order where your broker offers one, or in Smart Exit for the whole account.
A worked example: a share bought with a GTT stop
The numbers below show the steps; they are not a forecast or a suggested trade. Suppose you buy 50 shares of a stock at ₹1,585 for delivery and protect them with a GTT that sells at or below ₹1,550.
- On the stock's chart, a blue line at ₹1,585 says "LONG 50", with the profit or loss beside it.
- Below it, a red line at ₹1,550 says "GTT SELL 50 · at or below", with a Delete button.
- The price rises to ₹1,640. You press the GTT's tag and drag it up to ₹1,600.
- The "Change this GTT?" sheet shows "Trigger 1,550.00 → 1,600.00". You tap Change GTT.
- The line moves to ₹1,600 once the server confirms the change.
- If the price later falls to ₹1,600, the GTT places its sell order at your broker, the GTT line goes, and the position closes when the order fills.
Had the price already been below ₹1,600 when you dragged, the sheet would have said the GTT was not moved, because it would have fired at once.
Price alerts from the chart
The chart can also set a price alert on its instrument. An alert set from the chart is saved to your account with the note "Set from the chart". It sends a message when the price condition is met. It places no order. Use an alert when you want to be told about a level, and a GTT or an order when you want something to happen at it. Alerts are explained in our guide to market alerts.
Good habits when trading from the chart
- Read the tag before you lift your finger. It shows the new price while you drag.
- Confirm the sheet, not the chart. The sheet is the order; the line only shows where it is.
- Watch the "above" and "below" notes. A stop off the top of the screen is still working.
- Check which chart is active in a grid before tapping Buy or Sell; the buttons name the symbol.
- Use the pointer, not a drawing tool, to manage lines. With a drawing tool selected, tags cannot be dragged.
- Keep the number of working orders small. Lines beyond 12 are not drawn, and a crowded chart is easy to misread.
Common mistakes
- Dragging a line and leaving the sheet open. The order keeps its old price until you confirm. Close or confirm the sheet each time.
- Confusing a position with an order. Blue lines are positions; green and red lines are orders. Exit closes a position; Cancel removes an order.
- Exiting from the wrong holding. With the same instrument under two products or at two brokers, read the tag before you tap Exit.
- Placing a limit order on the wrong side of the market. A buy limit above the last price usually fills at once, much like a market order. Check where the amber line is before you tap Buy.
- Moving a stop too close. A stop just under the price can be hit by ordinary noise. The chart makes moving easy; that is not a reason to move it often.
Common problems
| Problem | What to do |
|---|---|
| No lines on the chart | Check that your broker is connected and signed in for the day, and that the chart shows a tradable instrument, not an index |
| A line has no tags | Expand the chart out of the grid, or switch the Scalper to Single |
| The line cannot be dragged | It is a bracket, cover or iceberg order, a market order, or an order your broker will not modify; cancel and place a new one instead |
| "This GTT was not moved" | The price has already reached the new trigger; choose a level the price has not reached |
| Buy and Sell are off | The feed is paused; wait for live prices to return |
| The "+" is missing | Expand the chart out of the grid, switch to the pointer, leave replay, and check that the last price is in view |
Orders, your broker and the rules
QuantPower is trading software, not a broker. Every order you start from a chart is an order on your own broker account, sent through the broker's official API from the static IP registered with your broker, after your broker's daily sign-in. Your funds and positions stay with your broker throughout. Orders from the chart are manual orders: you start each one yourself, and none runs on its own.
Pricing
Trading from the chart is free in QuantPower. Charts cost no tokens, and manual orders, from the chart or any other screen, cost no tokens. Your broker's brokerage and the statutory charges apply to each order. Tokens (1 token = ₹1, GST extra) pay for live algos, Forward tests of algos, backtests beyond the free ones and AI use. See pricing.
Start with 500 free tokens
Connect your broker, build a strategy and test it on paper before a single live order goes out.
Frequently asked questions
Can I change an order's price by dragging it on the chart?
Yes, for limit, SL and SL-M orders your broker lets QuantPower change. Drag the order's tag to the new price; the order sheet opens in Modify with that price for you to confirm.
What does the "+" on the chart do?
It puts an amber new-order line at the last price. Drag it to your price, then tap Buy or Sell on it to open the order sheet as a Limit order at that price.
Does a dragged line change my order straight away?
No. Dragging opens the Modify sheet, or "Change this GTT?" for a GTT. Your order at the broker keeps its old price until you confirm.
Which orders cannot be moved on the chart?
Bracket and cover orders, legs of an iceberg order, market orders and orders your broker marks as not modifiable. Their lines have no "↕" mark.
Why is my position line blue?
Positions are drawn in one colour, long or short, so they are never mistaken for buy or sell orders, which use the chart's up and down colours.
How many trade lines can one chart show?
Up to 12, with positions first. Lines outside the visible prices are counted at the top or bottom edge of the chart, and the rest stay on the Orders and Positions screens.
Can I move a GTT trigger from the chart?
Yes. Drag the GTT leg's line. A sheet shows the old and the new trigger and changes it only when you tap Change GTT. A trigger the price has already reached is not accepted.
Do Forward test trades show on the chart?
Yes. Forward test positions and orders appear as lines labelled "Forward test", separate from your real ones.
Related guides
- Multiple charts: several charts on one screen, each with its own lines
- Order types: limit, stop-loss, GTT and the rest explained
- Trading terminal: the chart, the order sheet and your positions on one screen
References
- Trading Technologies International, US patents 6,766,304 and 6,772,132, "Click based trading with intuitive grid display of market depth" (2004)
- CDSL and NSDL, demat account statistics, 2022 to 2026 (cdslindia.com, nsdl.co.in)
- QuantPower: chart trading lines, the order sheet and the order path, from the app's code, checked 12 November 2026